[TOC]
# **日志中心**
## 日志处理流程


## log-spring-boot-starter基础日志模块封装
log-spring-boot-starter的logback-spring.xml

此处修改
```
<springProperty name="LOG_FILE" scope="context" source="logging.file" defaultValue="/logs/${APP_NAME}"/>
```
将所有日志放在/logs下面,在部署微服务的机器中执行
```
mkdir /logs
chmod -R 777 /logs
```
还有一种方式,不需要修改上诉logback.xml配置,将微服务的日志都建立软连接,参考下面ln -s 建立软连接方式,
```
mkdir /logs
ln -s /app/ocp/user-center/logs/user-center/ /logs
ln -s /app/ocp/eureka-server/logs/eureka-server/ /logs
ln -s /app/ocp/api-gateway/logs/auth-gateway/ /logs
ln -s /app/ocp/api-gateway/logs/api-gateway/ /logs
ln -s /app/ocp/auth-server/logs/auth-server/ /logs
ln -s /app/ocp/file-center/logs/file-center/ /logs
```

以上两种方式目的是将所有的微服务日志都放在/logs中,方便filebeat抽取改目录的日志
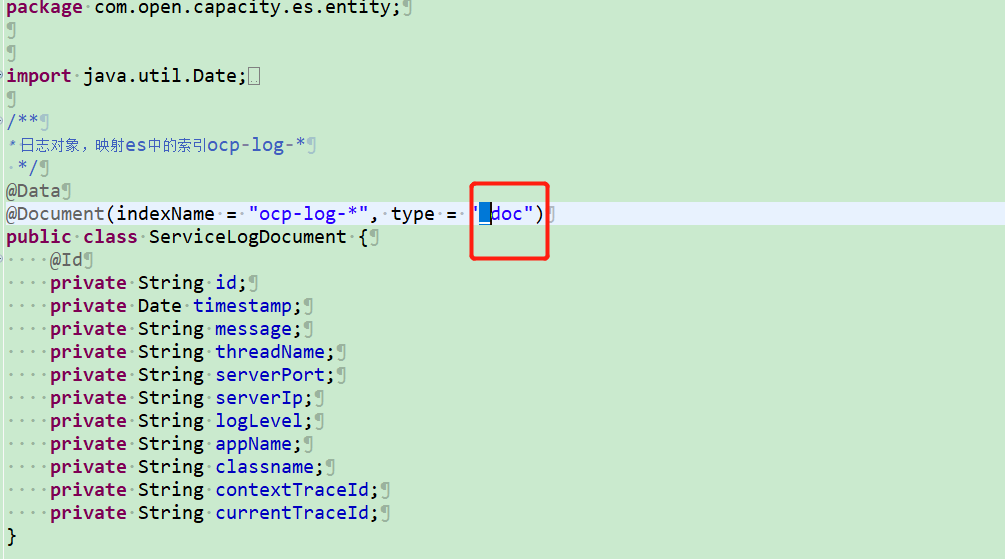
## log-center 对应es索引
* 对应es的索引字段
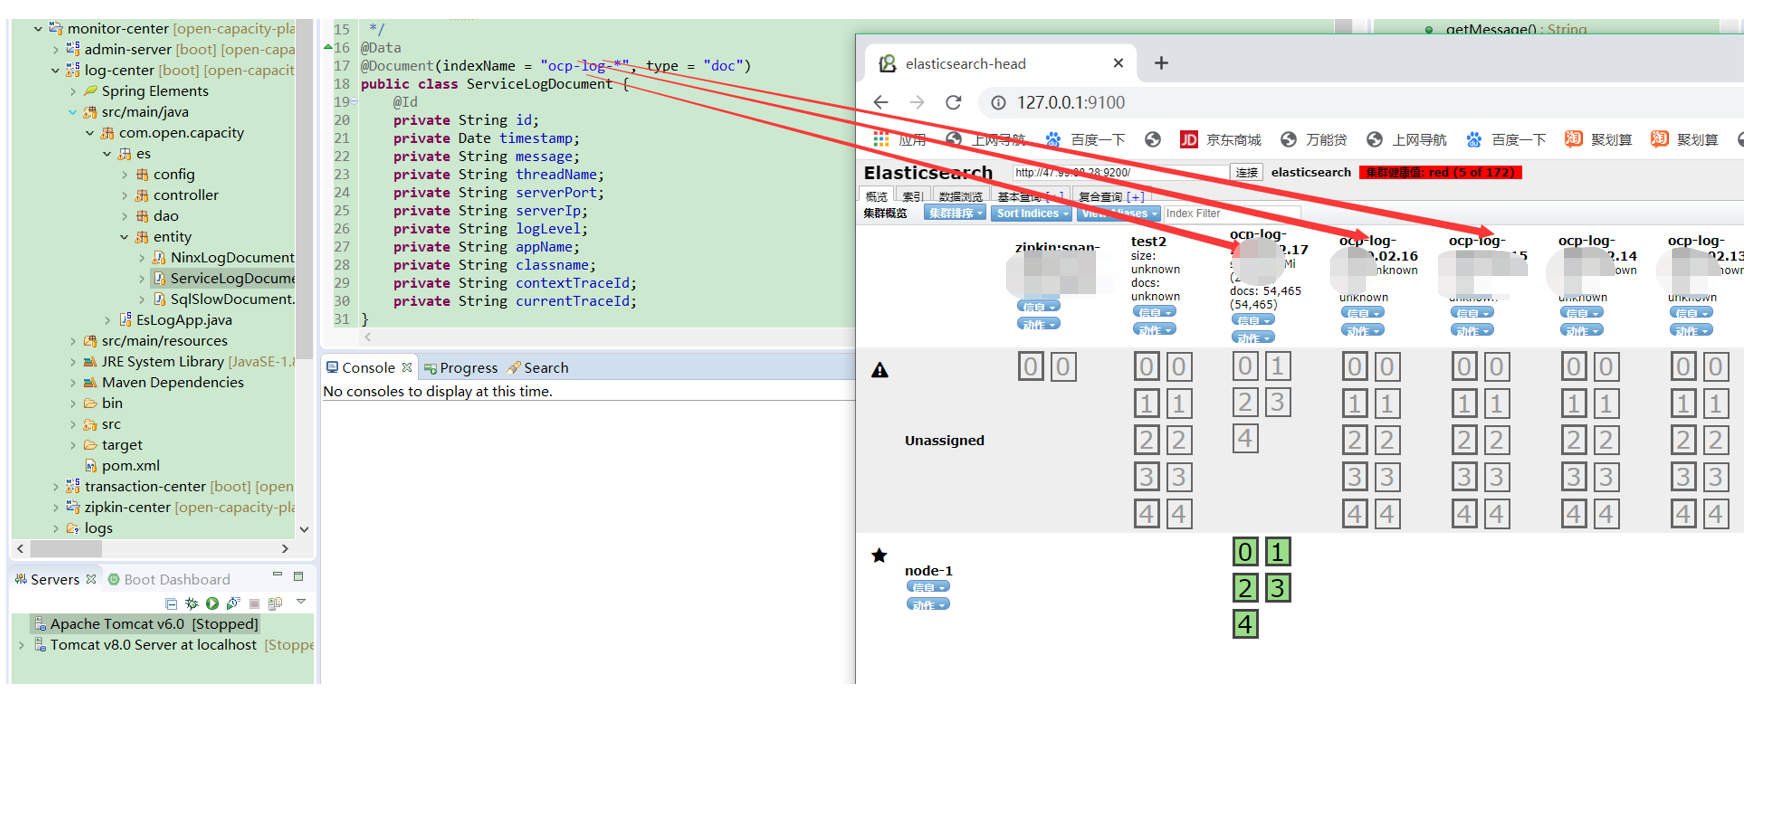
* java对象对应es的mapping信息

* ServiceLogDao读取Es数据到ServiceLogDocument中


## 核心原理

### Greenwich.SR6 版本es6 方式
此方式需要注意修改application.yml的配置,默认是es7配置
es6 application.yml需要按以下修改配置文件
```
spring:
#elasticsearch服务配置
data:
elasticsearch:
cluster-name: elasticsearch
cluster-nodes: 47.99.88.28:9300
repositories:
enabled: true
properties:
transport:
tcp:
connect_timeout: 120s
```
es6方式 type= doc

### Hoxton.SR8 版本es7方式 ([es7搭建方式](https://www.kancloud.cn/owenwangwen/open-capacity-platform/1656401))
默认是es7配置,high levl rest 高并发集成spring data es方式
配置文件
```
spring:
#elasticsearch服务配置
elasticsearch:
rest:
uris:
- http://192.168.11.130:9200
data:
elasticsearch:
client:
reactive:
endpoints : 192.168.11.130:9200
socket-timeout: 3000
connection-timeout: 3000
```
es7方式 type= _doc
## spring data es
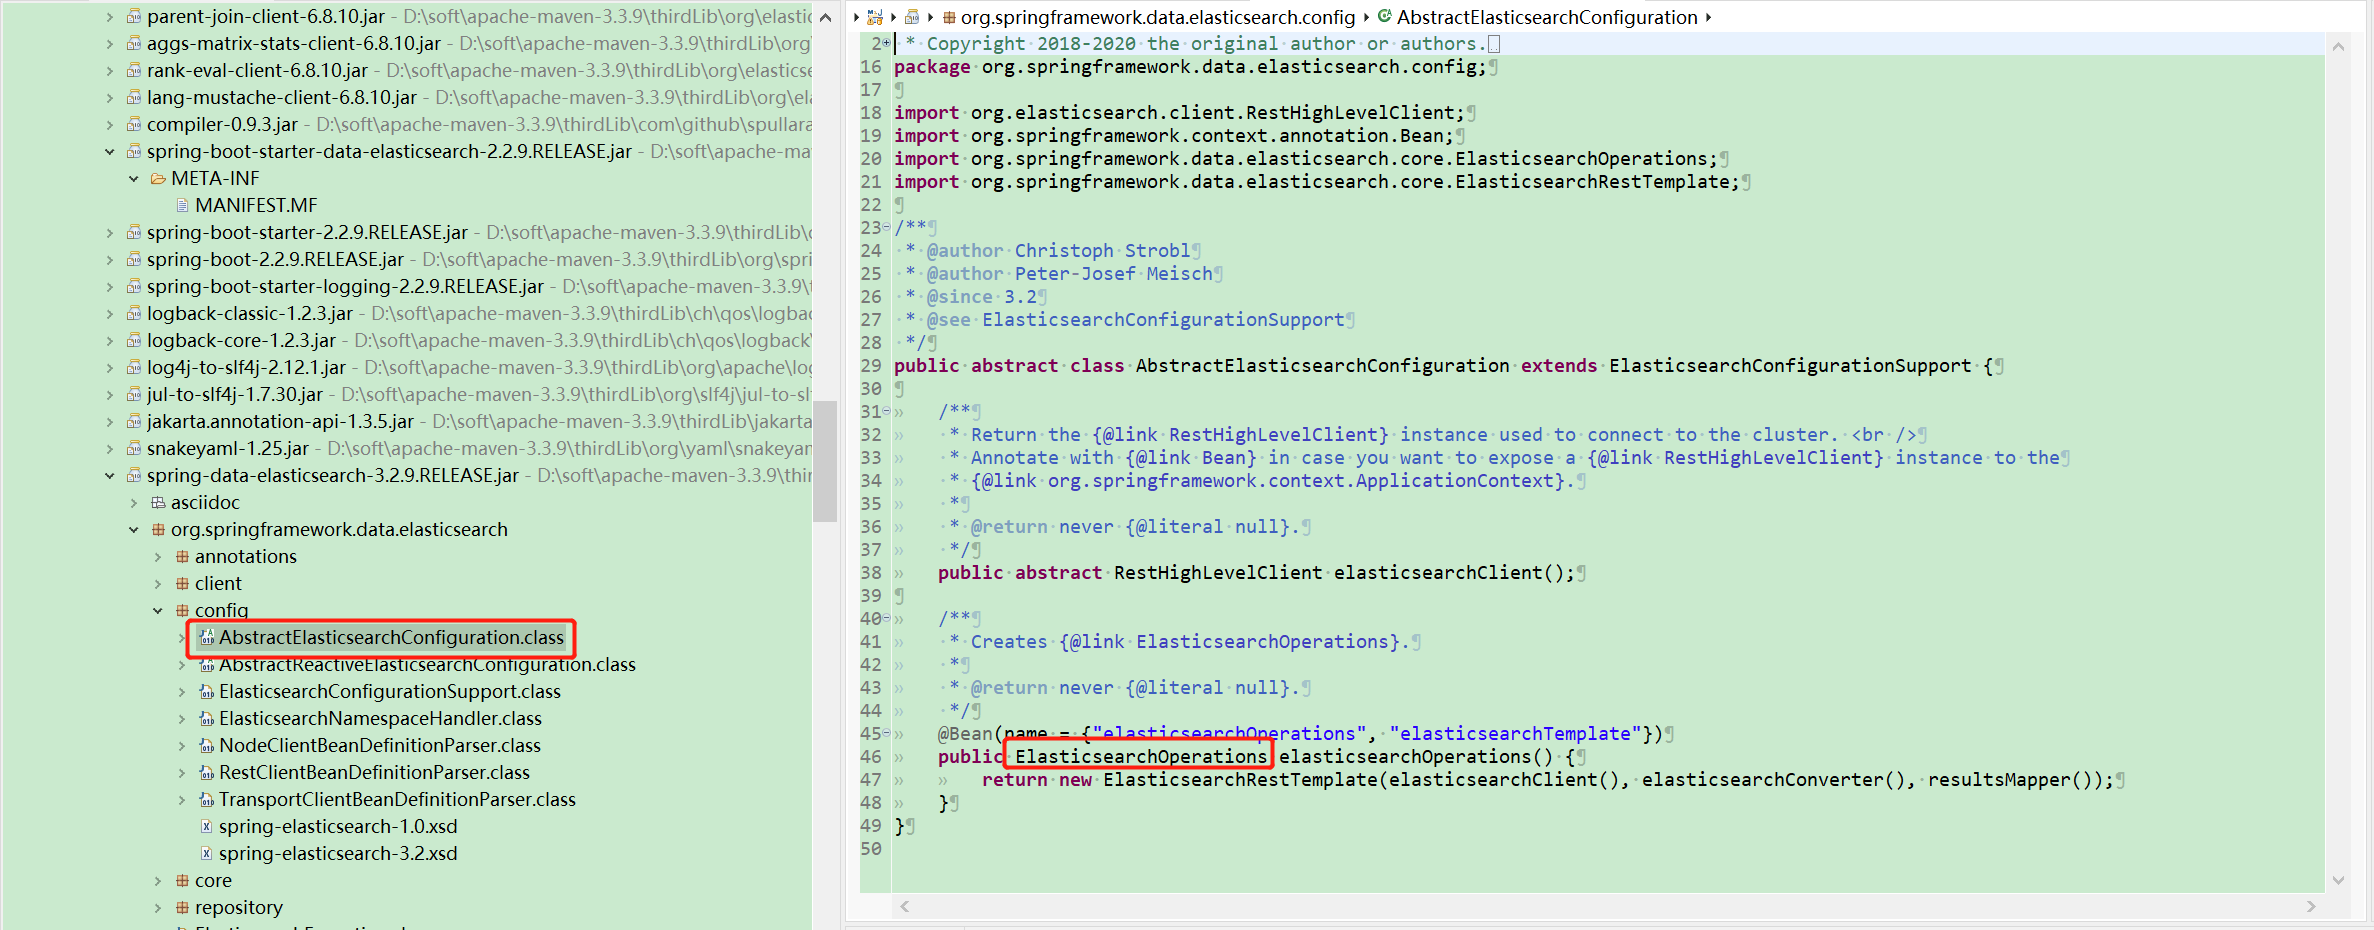
* AbstractElasticsearchConfiguration:创建
* ElasticsearchRestTemplate。
* AbstractReactiveElasticsearchConfiguration:创建
* ReactiveElasticsearchTemplate
* ElasticsearchRepositoryConfigExtension
* ReactiveElasticsearchRepositoryConfigurationExtension
* ElasticsearchCrudRepository:支持crud的抽象接口。
* ReactiveElasticsearchRepository:支持crud的reactive抽象接口。

ReactiveElasticsearchClient使用Elasticsearch core项目提供的请求/响应对象,调用直接在响应堆栈上操作,而不是使用异步线程池的方式进行响应。
这是高版本的Spring Data Elasticsearch默认支持的方式,使用方式如下:
```
elasticsearch:
rest:
uris:
- http://192.168.11.130:9200
data:
elasticsearch:
client:
reactive:
endpoints : 192.168.11.130:9200
socket-timeout: 3000
connection-timeout: 3000 =
```
## swagger访问接口
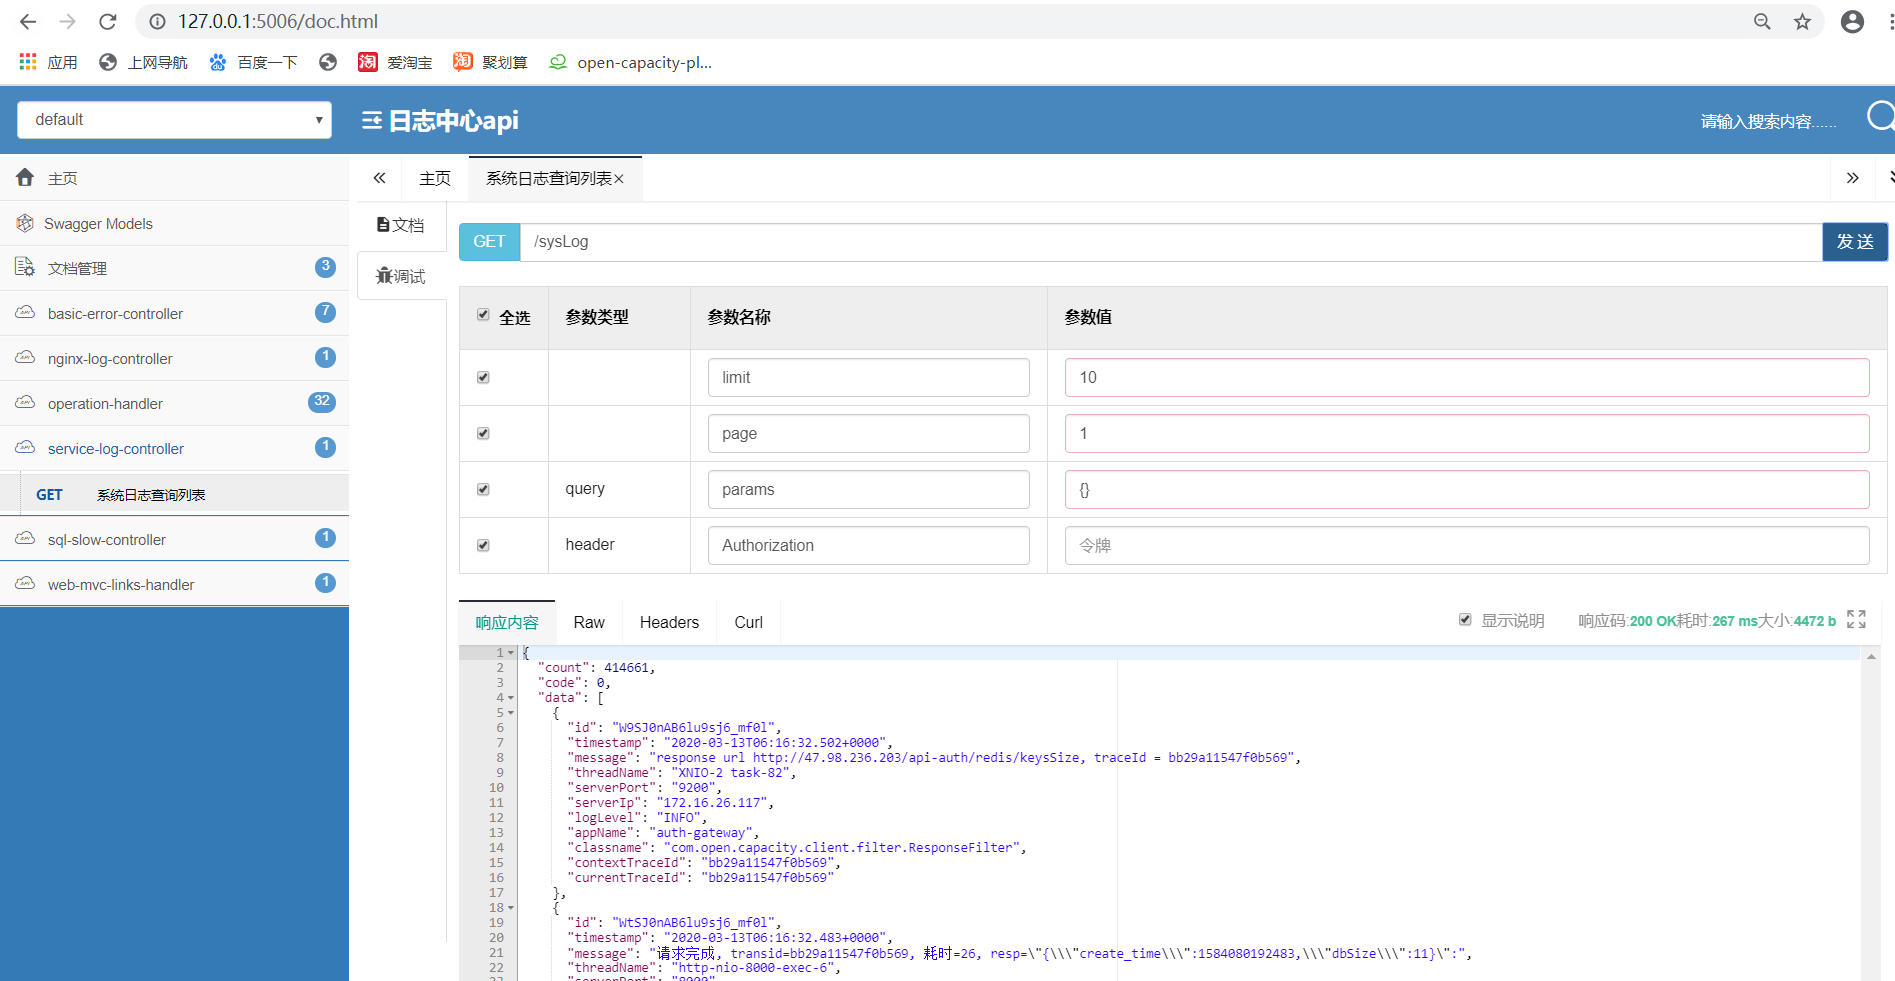
启动 log-center ,之前需要部署 Filebeat logstash elasticearch
| 软件 | 版本 | 备注 |
| --- | --- |--- |
| centos| 7.5 | |
| JDK | 1.8 |on 47.99.88.28 |
| elasticsearch| 6.5.4 |on 47.99.88.28|
|elasticsearch-head|6.x|windows|
| filebeat| 6.5.4|on 47.99.88.28 |
| logstash|6.5.4 |on 47.99.88.28 |
# elasticearch安装
## 创建目录
```
mkdir /app
cd /app
wget https://artifacts.elastic.co/downloads/elasticsearch/elasticsearch-6.5.4.tar.gz
tar -zxvf elasticsearch-6.5.4.tar.gz
useradd es
cd elasticsearch-6.5.4
修改config/jvm.options为内存的一半大小
vi config/jvm.options
-Xms512m
-Xmx512m
修改 max file 和 max virtual memory 参数
用root 或 sudo 用户
vi /etc/sysctl.conf
添加下面配置:
vm.max_map_count=655360
并执行命令:
sysctl -p
```
## 修改/etc/security/limits.conf
```
grep -q "* - nofile" /etc/security/limits.conf || cat >> /etc/security/limits.conf << EOF
########################################
* soft nofile 65536
* hard nofile 65536
* soft nproc 4096
* hard nproc 4096
EOF
```
## 修改elasticsearch.yml
```
vi /app/elasticsearch-6.5.4/config/elasticsearch.yml
cluster.name: elasticsearch
node.name: node-1
network.host: 0.0.0.0
http.port: 9200
node.max_local_storage_nodes: 2
http.cors.enabled: true
http.cors.allow-origin: "*"
```
## 赋权启动
```
chown -R es:es /app/elasticsearch-6.5.4/
su - es -c '/app/elasticsearch-6.5.4/bin/elasticsearch -d'
```
## 查看进程
```
jinfo -flags 2114
VM Flags:
-XX:+AlwaysPreTouch -XX:CICompilerCount=2 -XX:CMSInitiatingOccupancyFraction=75 -XX:ErrorFile=logs/hs_err_pid%p.log -XX:+HeapDumpOnOutOfMemoryError -XX:HeapDumpPath=data -XX:InitialHeapSize=536870912 -XX:MaxDirectMemorySize=268435456 -XX:MaxHeapSize=536870912 -XX:MaxNewSize=87228416 -XX:MaxTenuringThreshold=6 -XX:MinHeapDeltaBytes=196608 -XX:NewSize=87228416 -XX:NonNMethodCodeHeapSize=5825164 -XX:NonProfiledCodeHeapSize=122916538 -XX:OldSize=449642496 -XX:-OmitStackTraceInFastThrow -XX:ProfiledCodeHeapSize=122916538 -XX:-RequireSharedSpaces -XX:ReservedCodeCacheSize=251658240 -XX:+SegmentedCodeCache -XX:ThreadStackSize=1024 -XX:+UseCMSInitiatingOccupancyOnly -XX:+UseCompressedClassPointers -XX:+UseCompressedOops -XX:+UseConcMarkSweepGC -XX:-UseSharedSpaces
```
## 查看jvm参数
```
jinfo -flag MaxHeapSize 2114
-XX:MaxHeapSize=536870912
jinfo -flag NewSize 2114
-XX:NewSize=87228416
jinfo -flag ThreadStackSize 2114
-XX:ThreadStackSize=1024
jinfo -flag OldSize 2114
-XX:OldSize=449642496
```
## 动态修改jvm参数
```
jinfo -flag +HeapDumpOnOutOfMemoryError 2114
jinfo -flag HeapDumpPath=/app/elasticsearch-6.5.4/dump 2114
```
# logstash
## logstash 安装配置
```
cd /app
wget https://artifacts.elastic.co/downloads/logstash/logstash-6.5.4.tar.gz
tar -zxvf logstash-6.5.4.tar.gz
cd logstash-6.5.4/
ls
cd bin
```
## logstash.conf如下
vi logstash.conf
```
input {
beats {
port => 5044
}
}
filter {
if [fields][docType] == "sys-log" {
grok {
patterns_dir => ["/app/logstash-6.5.4/patterns"]
match => { "message" => "\[%{NOTSPACE:appName}\:%{NOTSPACE:serverIp}\:%{NOTSPACE:serverPort}\] \[%{MYAPPNAME:contextTraceId},%{MYAPPNAME:currentTraceId}\] %{TIMESTAMP_ISO8601:logTime} %{LOGLEVEL:logLevel} %{WORD:pid} \[%{MYTHREADNAME:threadName}\] %{NOTSPACE:classname} %{GREEDYDATA:message}" }
overwrite => ["message"]
}
date {
match => ["logTime","yyyy-MM-dd HH:mm:ss.SSS"]
}
date {
match => ["logTime","yyyy-MM-dd HH:mm:ss.SSS"]
target => "timestamp"
}
mutate {
remove_field => "logTime"
remove_field => "@version"
remove_field => "host"
remove_field => "offset"
}
}
}
output {
if [fields][docType] == "sys-log" {
elasticsearch {
hosts => ["127.0.0.1:9200"]
manage_template => false
index => "ocp-log-%{+YYYY.MM.dd}"
document_type => "%{[@metadata][type]}"
}
}
if [fields][docType] == "biz-log" {
elasticsearch {
hosts => ["127.0.0.1:9200"]
manage_template => false
index => "biz-log-%{+YYYY.MM.dd}"
document_type => "%{[@metadata][type]}"
}
}
}
```
## 在Logstash中使用grok
~~~
mkdir -p /app/logstash-6.5.4/patterns
cd /app/logstash-6.5.4/patterns
vi java
# user-center
MYAPPNAME ([0-9a-zA-Z_-]*)
MYTHREADNAME ([0-9a-zA-Z._-]|\(|\)|\s)*
~~~
## 权限
```
chmod -R 777 /app/logstash-6.5.4
```
## 启动
```
cd /app/logstash-6.5.4/bin
nohup ./logstash -f logstash.conf >&/dev/null &
```
# filebeat
## 注意filebeat与logstash在同一台服务器中
filebeat(收集、聚合) ->logstash(过滤结构化) -> ES

filebeat 抽取的是/logs/*/*.log的日志,可以建立软连接,将不同模块的日志都放在/logs下面
* 准备工作
```
mkdir /logs
ln -s /app/ocp/user-center/logs/user-center/ /logs
ln -s /app/ocp/eureka-server/logs/eureka-server/ /logs
ln -s /app/ocp/api-gateway/logs/auth-gateway/ /logs
ln -s /app/ocp/auth-server/logs/auth-server/ /logs
ln -s /app/ocp/file-center/logs/file-center/ /logs
```

* 下载filebeat
```
cd /app
wget https://artifacts.elastic.co/downloads/beats/filebeat/filebeat-6.5.4-linux-x86_64.tar.gz
tar -zxvf filebeat-6.5.4-linux-x86_64.tar.gz
cd /app/filebeat-6.5.4-linux-x86_64
```
* 配置filebeat.yml配置
vi filebeat.yml
```
###################### Filebeat Configuration Example #########################
# This file is an example configuration file highlighting only the most common
# options. The filebeat.reference.yml file from the same directory contains all the
# supported options with more comments. You can use it as a reference.
#
# You can find the full configuration reference here:
# https://www.elastic.co/guide/en/beats/filebeat/index.html
# For more available modules and options, please see the filebeat.reference.yml sample
# configuration file.
#=========================== Filebeat inputs =============================
filebeat.inputs:
# Each - is an input. Most options can be set at the input level, so
# you can use different inputs for various configurations.
# Below are the input specific configurations.
- type: log
enabled: true
paths:
#- /var/log/*.log
- /logs/*/*.log
##控制台日志
exclude_lines: ['^DEBUG']
##增加字段
fields:
docType: sys-log
project: open-capacity-platform
#聚合日志
multiline:
pattern: ^\[
negate: true
match: after
- type: log
enabled: true
paths:
#- /var/log/*.log
- /app/ocp/user-center/logs/biz/*.log
##业务日志
exclude_lines: ['^DEBUG']
##增加字段
fields:
docType: biz-log
project: open-capacity-platform
#聚合日志
#keys_under_root可以让字段位于根节点,默认为false
json.keys_under_root: true
#对于同名的key,覆盖原有key值
json.overwrite_keys: true
#message_key是用来合并多行json日志使用的,如果配置该项还需要配置multiline的设置,后面会讲
json.message_key: message
#将解析错误的消息记录储存在error.message字段中
json.add_error_key: true
# Exclude lines. A list of regular expressions to match. It drops the lines that are
# matching any regular expression from the list.
#exclude_lines: ['^DBG']
# Include lines. A list of regular expressions to match. It exports the lines that are
# matching any regular expression from the list.
#include_lines: ['^ERR', '^WARN']
# Exclude files. A list of regular expressions to match. Filebeat drops the files that
# are matching any regular expression from the list. By default, no files are dropped.
#exclude_files: ['.gz$']
# Optional additional fields. These fields can be freely picked
# to add additional information to the crawled log files for filtering
#fields:
# level: debug
# review: 1
### Multiline options
# Multiline can be used for log messages spanning multiple lines. This is common
# for Java Stack Traces or C-Line Continuation
# The regexp Pattern that has to be matched. The example pattern matches all lines starting with [
#multiline.pattern: ^\[
# Defines if the pattern set under pattern should be negated or not. Default is false.
#multiline.negate: false
# Match can be set to "after" or "before". It is used to define if lines should be append to a pattern
# that was (not) matched before or after or as long as a pattern is not matched based on negate.
# Note: After is the equivalent to previous and before is the equivalent to to next in Logstash
#multiline.match: after
#============================= Filebeat modules ===============================
filebeat.config.modules:
# Glob pattern for configuration loading
path: ${path.config}/modules.d/*.yml
# Set to true to enable config reloading
reload.enabled: false
# Period on which files under path should be checked for changes
#reload.period: 10s
#==================== Elasticsearch template setting ==========================
setup.template.settings:
index.number_of_shards: 3
setup.template.name: "filebeat"
setup.template.pattern: "filebeat-*"
#index.codec: best_compression
#_source.enabled: false
#================================ General =====================================
# The name of the shipper that publishes the network data. It can be used to group
# all the transactions sent by a single shipper in the web interface.
#name:
# The tags of the shipper are included in their own field with each
# transaction published.
#tags: ["service-X", "web-tier"]
# Optional fields that you can specify to add additional information to the
# output.
#fields:
# env: staging
#============================== Dashboards =====================================
# These settings control loading the sample dashboards to the Kibana index. Loading
# the dashboards is disabled by default and can be enabled either by setting the
# options here, or by using the `-setup` CLI flag or the `setup` command.
#setup.dashboards.enabled: false
# The URL from where to download the dashboards archive. By default this URL
# has a value which is computed based on the Beat name and version. For released
# versions, this URL points to the dashboard archive on the artifacts.elastic.co
# website.
#setup.dashboards.url:
#============================== Kibana =====================================
# Starting with Beats version 6.0.0, the dashboards are loaded via the Kibana API.
# This requires a Kibana endpoint configuration.
setup.kibana:
# Kibana Host
# Scheme and port can be left out and will be set to the default (http and 5601)
# In case you specify and additional path, the scheme is required: http://localhost:5601/path
# IPv6 addresses should always be defined as: https://[2001:db8::1]:5601
#host: "localhost:5601"
# Kibana Space ID
# ID of the Kibana Space into which the dashboards should be loaded. By default,
# the Default Space will be used.
#space.id:
#============================= Elastic Cloud ==================================
# These settings simplify using filebeat with the Elastic Cloud (https://cloud.elastic.co/).
# The cloud.id setting overwrites the `output.elasticsearch.hosts` and
# `setup.kibana.host` options.
# You can find the `cloud.id` in the Elastic Cloud web UI.
#cloud.id:
# The cloud.auth setting overwrites the `output.elasticsearch.username` and
# `output.elasticsearch.password` settings. The format is `<user>:<pass>`.
#cloud.auth:
#================================ Outputs =====================================
# Configure what output to use when sending the data collected by the beat.
#-------------------------- Elasticsearch output ------------------------------
#output.elasticsearch:
# Array of hosts to connect to.
# hosts: ["192.168.28.130:9200"]
# index: "filebeat-log"
# Optional protocol and basic auth credentials.
#protocol: "https"
#username: "elastic"
#password: "changeme"
#----------------------------- Logstash output --------------------------------
output.logstash:
# The Logstash hosts
hosts: ["127.0.0.1:5044"]
bulk_max_size: 2048
# Optional SSL. By default is off.
# List of root certificates for HTTPS server verifications
#ssl.certificate_authorities: ["/etc/pki/root/ca.pem"]
# Certificate for SSL client authentication
#ssl.certificate: "/etc/pki/client/cert.pem"
# Client Certificate Key
#ssl.key: "/etc/pki/client/cert.key"
#================================ Procesors =====================================
# Configure processors to enhance or manipulate events generated by the beat.
processors:
- add_host_metadata: ~
- add_cloud_metadata: ~
#================================ Logging =====================================
# Sets log level. The default log level is info.
# Available log levels are: error, warning, info, debug
#logging.level: debug
# At debug level, you can selectively enable logging only for some components.
# To enable all selectors use ["*"]. Examples of other selectors are "beat",
# "publish", "service".
#logging.selectors: ["*"]
#============================== Xpack Monitoring ===============================
# filebeat can export internal metrics to a central Elasticsearch monitoring
# cluster. This requires xpack monitoring to be enabled in Elasticsearch. The
# reporting is disabled by default.
# Set to true to enable the monitoring reporter.
#xpack.monitoring.enabled: false
# Uncomment to send the metrics to Elasticsearch. Most settings from the
# Elasticsearch output are accepted here as well. Any setting that is not set is
# automatically inherited from the Elasticsearch output configuration, so if you
# have the Elasticsearch output configured, you can simply uncomment the
# following line.
#xpack.monitoring.elasticsearch:
```
## 注意filebeat与logstash如果不在一台服务器中,上面的配置文件需要修改
```
output.logstash:
# The Logstash hosts ,假设在47.99.88.66部署了logstash
hosts: ["47.99.88.66:5044"]
bulk_max_size: 2048
```
* 权限
```
chmod -R 777 /app/filebeat-6.5.4
chmod go-w /app/filebeat-6.5.4/filebeat.yml
```
* 启动
```
nohup ./filebeat -e -c filebeat.yml >&/dev/null &
```
* lsof -p filebeat进程号查看启动情况
```
[root@iZbp178t3hp8rt4k9u953rZ filebeat-6.5.4]# lsof -p `ps | grep "filebeat" | grep -v "grep" |awk '{print $1}'`
COMMAND PID USER FD TYPE DEVICE SIZE/OFF NODE NAME
filebeat 15802 root cwd DIR 253,1 4096 2359362 /app/filebeat-6.5.4
filebeat 15802 root rtd DIR 253,1 4096 2 /
filebeat 15802 root txt REG 253,1 35930715 2359779 /app/filebeat-6.5.4/filebeat
filebeat 15802 root mem REG 253,1 61624 1052387 /usr/lib64/libnss_files-2.17.so
filebeat 15802 root mem REG 253,1 2156160 1052369 /usr/lib64/libc-2.17.so
filebeat 15802 root mem REG 253,1 19288 1052375 /usr/lib64/libdl-2.17.so
filebeat 15802 root mem REG 253,1 142232 1052395 /usr/lib64/libpthread-2.17.so
filebeat 15802 root mem REG 253,1 163400 1052362 /usr/lib64/ld-2.17.so
filebeat 15802 root 0w CHR 1,3 0t0 18 /dev/null
filebeat 15802 root 1w CHR 1,3 0t0 18 /dev/null
filebeat 15802 root 2w CHR 1,3 0t0 18 /dev/null
filebeat 15802 root 3u IPv4 583959162 0t0 TCP iZbp178t3hp8rt4k9u953rZ:47346->izbp1jc2amxbl3xjw02s2xz:XmlIpcRegSvc (ESTABLISHED)
filebeat 15802 root 4u a_inode 0,10 0 6091 [eventpoll]
filebeat 15802 root 5r REG 253,1 627836 1710139 /app/openresty/nginx/logs/access.log
filebeat 15802 root 6r REG 253,1 298509 1442290 /app/ocp/user-center/logs/user-center/user-center-info.log
filebeat 15802 root 7r REG 253,1 956962 1442293 /app/ocp/api-gateway/logs/api-gateway/api-gateway-info.log
filebeat 15802 root 8r REG 253,1 1347580 1442289 /app/ocp/auth-server/logs/auth-server/auth-server-info.log
filebeat 15802 root 10u IPv4 583959848 0t0 TCP iZbp178t3hp8rt4k9u953rZ:47348->izbp1jc2amxbl3xjw02s2xz:XmlIpcRegSvc (ESTABLISHED)
filebeat 15802 root 11r REG 253,1 50445 1442291 /app/ocp/file-center/logs/file-center/file-center-info.log
```
* 结构化日志数据为以下格式存在ES中
```
{
"contextTraceId":"上下文traceId",
"currentTraceId":"当前traceId",
"timestamp": "时间",
"message": "具体日志信息",
"threadName": "线程名",
"serverPort": "服务端口",
"serverIp": "服务ip",
"logLevel": "日志级别",
"appName": "工程名称",
"classname": "类名"
}
```
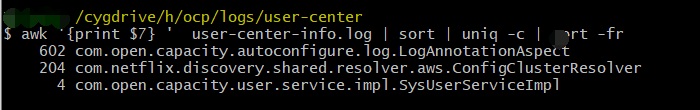
* linux统计调用次数
```
awk '{print $7} ' user-center-info.log | sort | uniq -c | sort -fr
```
# elasticseach-head
## 安装
1. 安装 ElasticSearch 6.x,访问 http://47.99.88.28:9200/ 查看是否安装成功。
2. 安装 Node,使用 node -v 查看是否安装成功。
3. 在 Node 中执行 npm install -g grunt-cli 安装grunt,使用 grunt -version 查看是否安装成功。
4. 安装 elasticsearch-head。
* 访问 https://github.com/mobz/elasticsearch-head 下载 head 插件(选择 zip 压缩包下载方式)。

* 修改 ~\\elasticsearch-6.6.2\\elasticsearch-head-master\\Gruntfile.js,在对应的位置加上 hostname:'\*' 配置项。

* 在 ~\\elasticsearch-6.6.2\\elasticsearch-head-master 下执行 npm install 开始安装,完成后可执行 grunt server 或者 npm run start 运行 head 插件。

* 安装成功,访问 http://localhost:9100/。

5. 答疑
Issue - 在 head 中连接 ES 失败。

对于 Access-Control-Allow-Origin 的问题,可以在 ElasticSearch 6.x 的 ~\\config\\elasticsearch.yml 文件的末尾加入以下代码:
```
http.cors.enabled: true
http.cors.allow-origin: "\*"
node.master: true node.data: true
```
配置更新后,重启 ES 即可连接成功。
## 使用

# 安装grokdebug
## 安装docker
```
[root@localhost ~]# systemctl stop firewalld
[root@localhost ~]# systemctl disable firewalld
[root@localhost ~]# sed -i 's/enforcing/disabled/' /etc/selinux/config
[root@localhost ~]# cat /etc/selinux/config
[root@localhost ~]# getenforce
[root@localhost ~]# setenforce 0
[root@localhost ~]# getenforce
[root@localhost ~]# sed -i 's/enforcing/disabled/' /etc/selinux/config
[root@localhost ~]# swapoff -a
[root@localhost ~]# yum install -y yum-utils device-mapper-persistent-data lvm2
[root@localhost ~]# wget https://mirrors.aliyun.com/docker-ce/linux/centos/docker-ce.repo -O /etc/yum.repos.d/docker-ce.repo
[root@localhost ~]# yum -y install docker-ce-18.06.1.ce-3.el7
[root@localhost ~]# systemctl enable docker && systemctl start docker
Created symlink from /etc/systemd/system/multi-user.target.wants/docker.service to /usr/lib/systemd/system/docker.service.
[root@localhost ~]# docker --version
Docker version 18.06.1-ce, build e68fc7a
```
## 安装docker compose
```
curl -L https://github.com/docker/compose/releases/download/1.24.1/docker-compose-`uname -s`-`uname -m` > /usr/local/bin/docker-compose
chmod +x /usr/local/bin/docker-compose
```
## 配置docker-compose.yml
```
[root@JD app]# cat docker-compose.yml
version: "3"
services:
grok:
image: epurs/grokdebugger
ports:
- "80:80"
```
## 启动
```
[root@JD app]# docker-compose up -d
```
## 查看
* [user-center:172.16.26.117:7000] [869f32593b6bbf6b,5aa8fbe5ba17b0d8] 2019-02-25 00:40:58.749 INFO 3417 [http-nio-7000-exec-197] com.open.capacity.log.aop.LogAnnotationAOP 开始请求,transid=869f32593b6bbf6b, url=com.open.capacity.user.controller.SysUserController/findByUsername , httpMethod=null, reqData=["admin"]
* \[%{NOTSPACE:appName}\:%{NOTSPACE:serverIp}\:%{NOTSPACE:serverPort}\] \[%{MYAPPNAME:contextTraceId},%{MYAPPNAME:currentTraceId}\] %{TIMESTAMP_ISO8601:logTime} %{LOGLEVEL:logLevel} %{WORD:pid} \[%{MYTHREADNAME:threadName}\] %{NOTSPACE:classname} %{GREEDYDATA:message}
* MYAPPNAME ([0-9a-zA-Z_-]*)
* MYTHREADNAME ([0-9a-zA-Z._-]|\(|\)|\s)*

## 解析后文件
```
~~~
{
"appName": [
[
"user-center"
]
],
"serverIp": [
[
"172.16.26.117"
]
],
"serverPort": [
[
"7000"
]
],
"contextTraceId": [
[
"869f32593b6bbf6b"
]
],
"currentTraceId": [
[
"5aa8fbe5ba17b0d8"
]
],
"logTime": [
[
"2019-02-25 00:40:58.749"
]
],
"YEAR": [
[
"2019"
]
],
"MONTHNUM": [
[
"02"
]
],
"MONTHDAY": [
[
"25"
]
],
"HOUR": [
[
"00",
null
]
],
"MINUTE": [
[
"40",
null
]
],
"SECOND": [
[
"58.749"
]
],
"ISO8601_TIMEZONE": [
[
null
]
],
"logLevel": [
[
"INFO"
]
],
"pid": [
[
"3417"
]
],
"threadName": [
[
"http-nio-7000-exec-197"
]
],
"classname": [
[
"com.open.capacity.log.aop.LogAnnotationAOP"
]
],
"message": [
[
"开始请求,transid=869f32593b6bbf6b, url=com.open.capacity.user.controller.SysUserController/findByUsername , httpMethod=null, reqData=["admin"] "
]
]
}
~~~
```
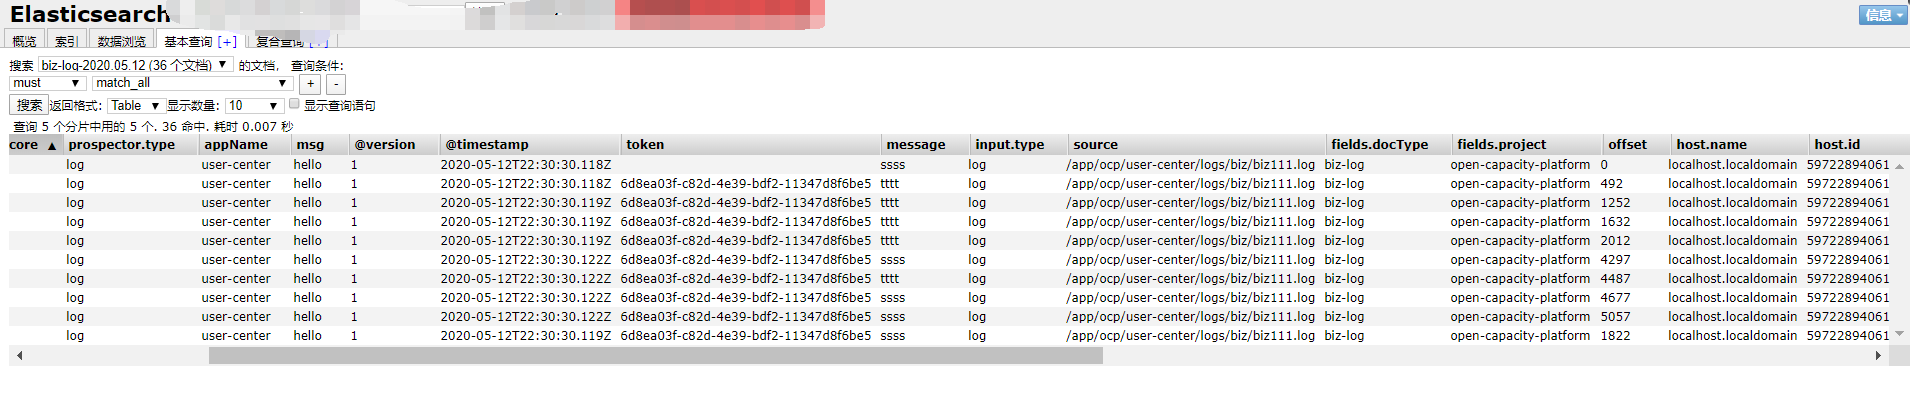
# 业务日志
业务日志采用结构化输出
{"message":"tttt","transId":"46d803fd318f1dd3","token":"6d8ea03f-c82d-4e39-bdf2-11347d8f6be5","username":"admin","msg":"hello","error":null,"host":"130.75.131.208","appName":"user-center"}
这样可以不再使用logstash的gork格式化日志。
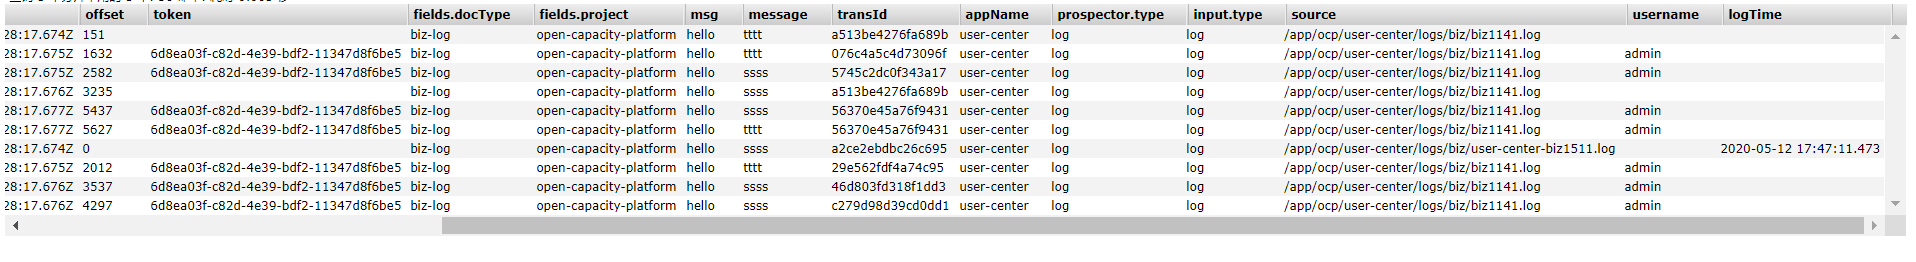
* 代码使用
BizLog.info("角色列表", LogEntry.builder().clazz(this.getClass().getName()).method("findRoles").msg("hello").path("/roles").build());
* 效果
## filebeat 结构化日志es
```
#=========================== Filebeat inputs =============================
filebeat.inputs:
# Each - is an input. Most options can be set at the input level, so
# you can use different inputs for various configurations.
# Below are the input specific configurations.
- type: log
enabled: true
paths:
#- /var/log/*.log
- /app/ocp/user-center/logs/biz/*.log
exclude_lines: ['^DEBUG']
##增加字段
fields:
docType: biz-log
project: open-capacity-platform
#聚合日志
#keys_under_root可以让字段位于根节点,默认为false
json.keys_under_root: true
#对于同名的key,覆盖原有key值
json.overwrite_keys: true
#message_key是用来合并多行json日志使用的,如果配置该项还需要配置multiline的设置,后面会讲
json.message_key: message
#将解析错误的消息记录储存在error.message字段中
json.add_error_key: true
#============================= Filebeat modules ===============================
filebeat.config.modules:
# Glob pattern for configuration loading
path: ${path.config}/modules.d/*.yml
# Set to true to enable config reloading
reload.enabled: false
# Period on which files under path should be checked for changes
#reload.period: 10s
#==================== Elasticsearch template setting ==========================
setup.template.settings:
index.number_of_shards: 3
setup.template.name: "filebeat"
setup.template.pattern: "filebeat-*"
#index.codec: best_compression
#_source.enabled: false
setup.kibana:
# Kibana Host
# Scheme and port can be left out and will be set to the default (http and 5601)
# In case you specify and additional path, the scheme is required: http://localhost:5601/path
# IPv6 addresses should always be defined as: https://[2001:db8::1]:5601
#host: "localhost:5601"
# Kibana Space ID
# ID of the Kibana Space into which the dashboards should be loaded. By default,
# the Default Space will be used.
#space.id:
output.elasticsearch:
enabled: true
hosts: ["127.0.0.1:9200"]
index: "biz-log-%{+yyyy-MM-dd}"
#================================ Processors =====================================
# Configure processors to enhance or manipulate events generated by the beat.
processors:
#- add_host_metadata: ~
#- add_cloud_metadata: ~
- drop_fields:
fields: ["beat.name", "beat.version", "host.architecture","host.architecture","host.name","beat.hostname","log.file.path"]
```
生产建议参考
[13.统一日志中心](11.%E7%BB%9F%E4%B8%80%E6%97%A5%E5%BF%97%E4%B8%AD%E5%BF%83.md)
- 前言
- 1.项目说明
- 2.项目更新日志
- 3.文档更新日志
- 01.快速开始
- 01.maven构建项目
- 02.环境安装
- 03.STS项目导入
- 03.IDEA项目导入
- 04.数据初始化
- 05.项目启动
- 06.付费文档说明
- 02.总体流程
- 1.oauth接口
- 2.架构设计图
- 3.微服务介绍
- 4.功能介绍
- 5.梳理流程
- 03.模块详解
- 01.老版本1.0.1分支模块讲解
- 01.db-core模块
- 02.api-commons模块
- 03.log-core模块
- 04.security-core模块
- 05.swagger-core模块
- 06.eureka-server模块
- 07.auth-server模块
- 08.auth-sso模块解析
- 09.user-center模块
- 10.api-gateway模块
- 11.file-center模块
- 12.log-center模块
- 13.batch-center模块
- 14.back-center模块
- 02.spring-boot-starter-web那点事
- 03.自定义db-spring-boot-starter
- 04.自定义log-spring-boot-starter
- 05.自定义redis-spring-boot-starter
- 06.自定义common-spring-boot-starter
- 07.自定义swagger-spring-boot-starter
- 08.自定义uaa-server-spring-boot-starter
- 09.自定义uaa-client-spring-boot-starter
- 10.自定义ribbon-spring-boot-starter
- 11.springboot启动原理
- 12.eureka-server模块
- 13.auth-server模块
- 14.user-center模块
- 15.api-gateway模块
- 16.file-center模块
- 17.log-center模块
- 18.back-center模块
- 19.auth-sso模块
- 20.admin-server模块
- 21.zipkin-center模块
- 22.job-center模块
- 23.batch-center
- 04.全新网关
- 01.基于spring cloud gateway的new-api-gateway
- 02.spring cloud gateway整合Spring Security Oauth
- 03.基于spring cloud gateway的redis动态路由
- 04.spring cloud gateway聚合swagger文档
- 05.技术详解
- 01.互联网系统设计原则
- 02.系统幂等性设计与实践
- 03.Oauth最简向导开发指南
- 04.oauth jdbc持久化策略
- 05.JWT token方式启用
- 06.token有效期的处理
- 07.@PreAuthorize注解分析
- 08.获取当前用户信息
- 09.认证授权白名单配置
- 10.OCP权限设计
- 11.服务安全流程
- 12.认证授权详解
- 13.验证码技术
- 14.短信验证码登录
- 15.动态数据源配置
- 16.分页插件使用
- 17.缓存击穿
- 18.分布式主键生成策略
- 19.分布式定时任务
- 20.分布式锁
- 21.网关多维度限流
- 22.跨域处理
- 23.容错限流
- 24.应用访问次数控制
- 25.统一业务异常处理
- 26.日志埋点
- 27.GPRC内部通信
- 28.服务间调用
- 29.ribbon负载均衡
- 30.微服务分布式跟踪
- 31.异步与线程传递变量
- 32.死信队列延时消息
- 33.单元测试用例
- 34.Greenwich.RELEASE升级
- 35.混沌工程质量保证
- 06.开发初探
- 1.开发技巧
- 2.crud例子
- 3.新建服务
- 4.区分前后台用户
- 07.分表分库
- 08.分布式事务
- 1.Seata介绍
- 2.Seata部署
- 09.shell部署
- 01.eureka-server
- 02.user-center
- 03.auth-server
- 04.api-gateway
- 05.file-center
- 06.log-center
- 07.back-center
- 08.编写shell脚本
- 09.集群shell部署
- 10.集群shell启动
- 11.部署阿里云问题
- 10.网关安全
- 1.openresty https保障服务安全
- 2.openresty WAF应用防火墙
- 3.openresty 高可用
- 11.docker配置
- 01.docker安装
- 02.Docker 开启远程API
- 03.采用docker方式打包到服务器
- 04.docker创建mysql
- 05.docker网络原理
- 06.docker实战
- 6.01.安装docker
- 6.02.管理镜像基本命令
- 6.03.容器管理
- 6.04容器数据持久化
- 6.05网络模式
- 6.06.Dockerfile
- 6.07.harbor部署
- 6.08.使用自定义镜像
- 12.统一监控中心
- 01.spring boot admin监控
- 02.Arthas诊断利器
- 03.nginx监控(filebeat+es+grafana)
- 04.Prometheus监控
- 05.redis监控(redis+prometheus+grafana)
- 06.mysql监控(mysqld_exporter+prometheus+grafana)
- 07.elasticsearch监控(elasticsearch-exporter+prometheus+grafana)
- 08.linux监控(node_exporter+prometheus+grafana)
- 09.micoservice监控
- 10.nacos监控
- 11.druid数据源监控
- 12.prometheus.yml
- 13.grafana告警
- 14.Alertmanager告警
- 15.监控微信告警
- 16.关于接口监控告警
- 17.prometheus-HA架构
- 18.总结
- 13.统一日志中心
- 01.统一日志中心建设意义
- 02.通过ELK收集mysql慢查询日志
- 03.通过elk收集微服务模块日志
- 04.通过elk收集nginx日志
- 05.统一日志中心性能优化
- 06.kibana安装部署
- 07.日志清理方案
- 08.日志性能测试指标
- 09.总结
- 14.数据查询平台
- 01.数据查询平台架构
- 02.mysql配置bin-log
- 03.单节点canal-server
- 04.canal-ha部署
- 05.canal-kafka部署
- 06.实时增量数据同步mysql
- 07.canal监控
- 08.clickhouse运维常见脚本
- 15.APM监控
- 1.Elastic APM
- 2.Skywalking
- 01.docker部署es
- 02.部署skywalking-server
- 03.部署skywalking-agent
- 16.压力测试
- 1.ocp.jmx
- 2.test.bat
- 3.压测脚本
- 4.压力报告
- 5.报告分析
- 6.压测平台
- 7.并发测试
- 8.wrk工具
- 9.nmon
- 10.jmh测试
- 17.SQL优化
- 1.oracle篇
- 01.基线测试
- 02.调优前奏
- 03.线上瓶颈定位
- 04.执行计划解读
- 05.高级SQL语句
- 06.SQL tuning
- 07.数据恢复
- 08.深入10053事件
- 09.深入10046事件
- 2.mysql篇
- 01.innodb存储引擎
- 02.BTree索引
- 03.执行计划
- 04.查询优化案例分析
- 05.为什么会走错索引
- 06.表连接优化问题
- 07.Connection连接参数
- 08.Centos7系统参数调优
- 09.mysql监控
- 10.高级SQL语句
- 11.常用维护脚本
- 12.percona-toolkit
- 18.redis高可用方案
- 1.免密登录
- 2.安装部署
- 3.配置文件
- 4.启动脚本
- 19.消息中间件搭建
- 19-01.rabbitmq集群搭建
- 01.rabbitmq01
- 02.rabbitmq02
- 03.rabbitmq03
- 04.镜像队列
- 05.haproxy搭建
- 06.keepalived
- 19-02.rocketmq搭建
- 19-03.kafka集群
- 20.mysql高可用方案
- 1.环境
- 2.mysql部署
- 3.Xtrabackup部署
- 4.Galera部署
- 5.galera for mysql 集群
- 6.haproxy+keepalived部署
- 21.es集群部署
- 22.生产实施优化
- 1.linux优化
- 2.jvm优化
- 3.feign优化
- 4.zuul性能优化
- 23.线上问题诊断
- 01.CPU性能评估工具
- 02.内存性能评估工具
- 03.IO性能评估工具
- 04.网络问题工具
- 05.综合诊断评估工具
- 06.案例诊断01
- 07.案例诊断02
- 08.案例诊断03
- 09.案例诊断04
- 10.远程debug
- 24.fiddler抓包实战
- 01.fiddler介绍
- 02.web端抓包
- 03.app抓包
- 25.疑难解答交流
- 01.有了auth/token获取token了为啥还要配置security的登录配置
- 02.权限数据存放在redis吗,代码在哪里啊
- 03.其他微服务和认证中心的关系
- 04.改包问题
- 05.use RequestContextListener or RequestContextFilter to expose the current request
- 06./oauth/token对应代码在哪里
- 07.验证码出不来
- 08./user/login
- 09.oauth无法自定义权限表达式
- 10.sleuth引发线程数过高问题
- 11.elk中使用7x版本问题
- 12.RedisCommandTimeoutException问题
- 13./oauth/token CPU过高
- 14.feign与权限标识符问题
- 15.动态路由RedisCommandInterruptedException: Command interrupted
- 26.学习资料
- 海量学习资料等你来拿
- 27.持续集成
- 01.git安装
- 02.代码仓库gitlab
- 03.代码仓库gogs
- 04.jdk&&maven
- 05.nexus安装
- 06.sonarqube
- 07.jenkins
- 28.Rancher部署
- 1.rancher-agent部署
- 2.rancher-server部署
- 3.ocp后端部署
- 4.演示前端部署
- 5.elk部署
- 6.docker私服搭建
- 7.rancher-server私服
- 8.rancher-agent docker私服
- 29.K8S部署OCP
- 01.准备OCP的构建环境和部署环境
- 02.部署顺序
- 03.在K8S上部署eureka-server
- 04.在K8S上部署mysql
- 05.在K8S上部署redis
- 06.在K8S上部署auth-server
- 07.在K8S上部署user-center
- 08.在K8S上部署api-gateway
- 09.在K8S上部署back-center
- 30.Spring Cloud Alibaba
- 01.统一的依赖管理
- 02.nacos-server
- 03.生产可用的Nacos集群
- 04.nacos配置中心
- 05.common.yaml
- 06.user-center
- 07.auth-server
- 08.api-gateway
- 09.log-center
- 10.file-center
- 11.back-center
- 12.sentinel-dashboard
- 12.01.sentinel流控规则
- 12.02.sentinel熔断降级规则
- 12.03.sentinel热点规则
- 12.04.sentinel系统规则
- 12.05.sentinel规则持久化
- 12.06.sentinel总结
- 13.sentinel整合openfeign
- 14.sentinel整合网关
- 1.sentinel整合zuul
- 2.sentinel整合scg
- 15.Dubbo与Nacos共存
- 31.Java源码剖析
- 01.基础数据类型和String
- 02.Arrays工具类
- 03.ArrayList源码分析
- 32.面试专题汇总
- 01.JVM专题汇总
- 02.多线程专题汇总
- 03.Spring专题汇总
- 04.springboot专题汇总
- 05.springcloud面试汇总
- 文档问题跟踪处理