
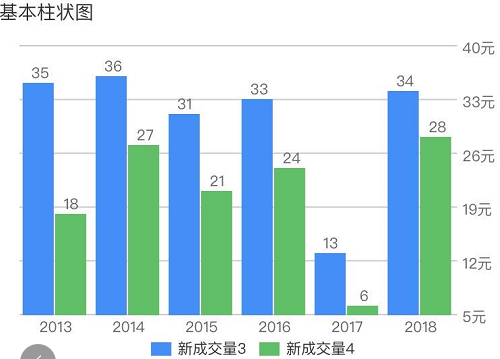
> 有时候App里要求以图表方式展示数据,比如柱状图、饼状图等,这个时候就需要用到uCharts
> 展示效果
> 
* [导入u-charts插件](https://www.kancloud.cn/wangking/uniapp/1983111#ucharts_6)
* [服务端返回的json](https://www.kancloud.cn/wangking/uniapp/1983111#json_10)
* [页面中进行使用](https://www.kancloud.cn/wangking/uniapp/1983111#_14)
## 导入u-charts插件
> 插件地址:[https://ext.dcloud.net.cn/plugin?id=271](https://ext.dcloud.net.cn/plugin?id=271)
> 将插件导入到 /components目录下即可,至于引入,在页面前端调用时import引入
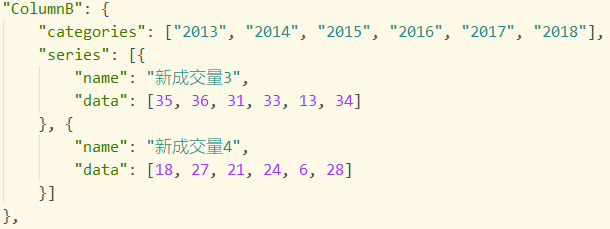
## 服务端返回的json
> 接口测试地址:[https://www.ucharts.cn/data.json](https://www.ucharts.cn/data.json)
> 
## 页面中进行使用
~~~
<template>
<view class="qiun-columns">
<view class="qiun-bg-white qiun-title-bar qiun-common-mt">
<view class="qiun-title-dot-light">基本柱状图</view>
</view>
<view class="qiun-charts">
<canvas canvas-id="canvasColumn" id="canvasColumn" class="charts" @touchstart="touchColumn"></canvas>
</view>
</view>
</template>
<script>
import uCharts from '@/components/u-charts/u-charts.js';
var _self;
var canvaColumn = null;
export default {
data() {
return {
cWidth: '',
cHeight: '',
pixelRatio: 1
}
},
onLoad() {
_self = this;
this.cWidth = uni.upx2px(750);
this.cHeight = uni.upx2px(500);
this.getServerData();
},
methods: {
getServerData() {
uni.request({
url: 'https://www.ucharts.cn/data.json',
data: {},
success: function(res) {
console.log(res.data.data)
let Column = {
categories: [],
series: []
};
//这里我后台返回的是数组,所以用等于,如果您后台返回的是单条数据,需要push进去
Column.categories = res.data.data.ColumnB.categories;
Column.series = res.data.data.ColumnB.series;
_self.showColumn("canvasColumn", Column);
},
fail: () => {
_self.tips = "网络错误,小程序端请检查合法域名";
},
});
},
showColumn(canvasId, chartData) {
canvaColumn = new uCharts({
$this: _self,
canvasId: canvasId,
type: 'column',
padding: [15, 5, 0, 15],
legend: {
show: true,
padding: 5,
lineHeight: 11,
margin: 0,
},
fontSize: 11,
background: '#FFFFFF',
pixelRatio: _self.pixelRatio,
animation: true,
categories: chartData.categories,
series: chartData.series,
xAxis: {
disableGrid: true,
},
yAxis: {
data: [{
position: 'right',
axisLine: false,
format: (val) => {
return val.toFixed(0) + '元'
},
}]
},
dataLabel: true,
width: _self.cWidth * _self.pixelRatio,
height: _self.cHeight * _self.pixelRatio,
extra: {
column: {
type: 'group',
width: _self.cWidth * _self.pixelRatio * 0.45 / chartData.categories.length
}
}
});
},
touchColumn(e) {
canvaColumn.showToolTip(e, {
format: function(item, category) {
if (typeof item.data === 'object') {
return category + ' ' + item.name + ':' + item.data.value
} else {
return category + ' ' + item.name + ':' + item.data
}
}
});
canvaColumn.touchLegend(e, {
animation: true
});
}
}
}
</script>
<style>
/*样式的width和height一定要与定义的cWidth和cHeight相对应*/
.qiun-charts {
width: 750upx;
height: 500upx;
background-color: #FFFFFF;
}
.charts {
width: 750upx;
height: 500upx;
background-color: #FFFFFF;
}
</style>
~~~
- 基础知识
- UNI核心介绍
- flex布局
- 生命周期
- 全局方法
- 组件定义
- 自定义组件
- 全局组件
- 组件之间的数据传输
- 条件编译
- 自定义头部
- 节点信息 (SelectorQuery)
- vuejs基础语法
- 页面跳转以及参数传递
- 事件的监听注册以及触发
- css3动画
- block的妙用
- mixin (混入)
- uniapp快捷键
- vuex状态管理
- 实用功能
- 获取服务提供商
- 启动页 / 启动界面
- 引导页
- tabbar配置
- 头部导航栏基础设置
- 上拉下拉(刷新/加载)
- 第三方登录
- 第三方分享
- 推送通知 之 unipush
- scroll-view双联动
- 配置iOS通用链接(Universal Links)
- 本地缓存操作
- 升级/更新方案
- 热更新
- 图片上传
- 搜索页实现
- canvas绘图助手
- 地图定位
- 第三方支付————todo
- 分类轮播
- 清除应用缓存
- uniapp与webview的实时通讯
- 视频-----todo
- 聊天----todo
- 长列表swiper左右切换
- 第三方插件
- uview
- mescroll
- uCharts (图表)
- 无名 (更新插件)
- 第三方模版
- 自定义基座
- 打包发行
- 要封装的方法
- 缓存 cache.js
- 请求接口 request.js
- 工具类 util.js
- 小程序登录 xcxLogin.js
- 版本更新 update.js
- 优质插件
- 更新插件----todo
- 语音
- 语音识别 (含上传)
- 百度语音合成播报接口
- 官方常用组建
- input 输入框
- image 图片
- audio 音频
- picker 选择器
- video 视频
- scroll-view 滚动视图
- uni-app 地图全解析+事件监听