
[TOC]
# DevTools
### Vue has a great panel that integrates into the Browser Developer Tools, which lets you inspect your application and interact with it, to ease debugging and understanding
- [Install on Chrome](#install-on-chrome)
- [Install on Firefox](#install-on-firefox)
- [Install the standalone app](#install-the-standalone-app)
- [How to use the Developer Tools](#how-to-use-the-developer-tools)
- [Filter components](#filter-components)
- [Select component in the page](#select-component-in-the-page)
- [Format components names](#format-components-names)
- [Filter inspected data](#filter-inspected-data)
- [Inspect DOM](#inspect-dom)
- [Open in editor](#open-in-editor)
- - - - - -
When you're first experimenting with Vue, if you open the Browser Developer Tools you will find this message: "*Download the Vue Devtools extension for a better development experience: <https://github.com/vuejs/vue-devtools>*"
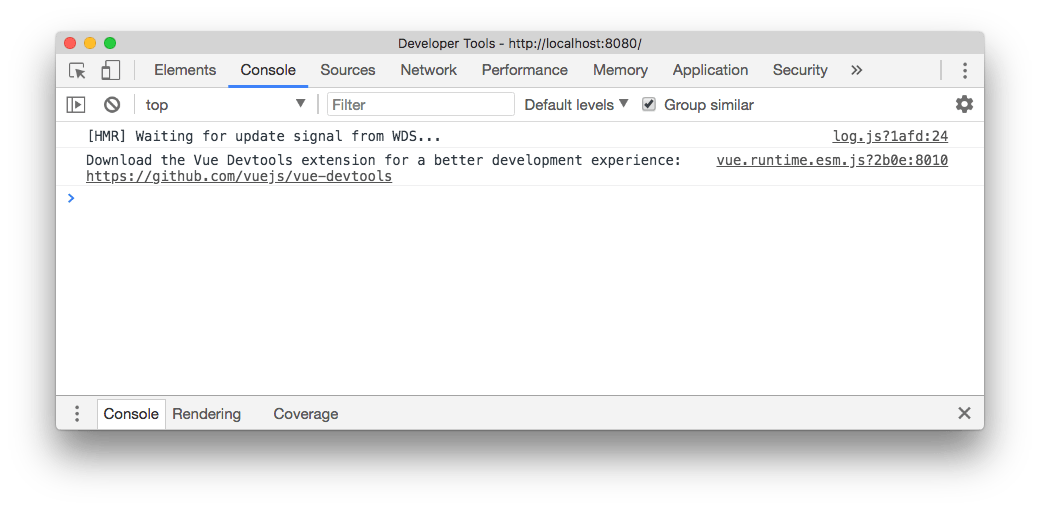
This is a friendly reminder to install the **Vue Devtools Extension**. What's that? Any popular framework has its own devtools extension, which generally adds a new panel to the browser developer tools that is much more specialized than the ones that the browser ships by default. In this case, the panel will let us inspect our Vue application and interact with it.
This tool will be an amazing help when building Vue apps. The developer tools can only inspect a Vue application when it's in development mode. This makes sure no one can use them to interact with your production app (and will make Vue more performant because it does not have to care about the devtools)
Let's install it!
There are 3 ways to install the Vue Dev Tools:
- on Chrome
- on Firefox
- as a standalone application
Safari, Edge and other browsers are not supported with a custom extension, but using the standalone application you can debug a Vue.js app running in any browser.
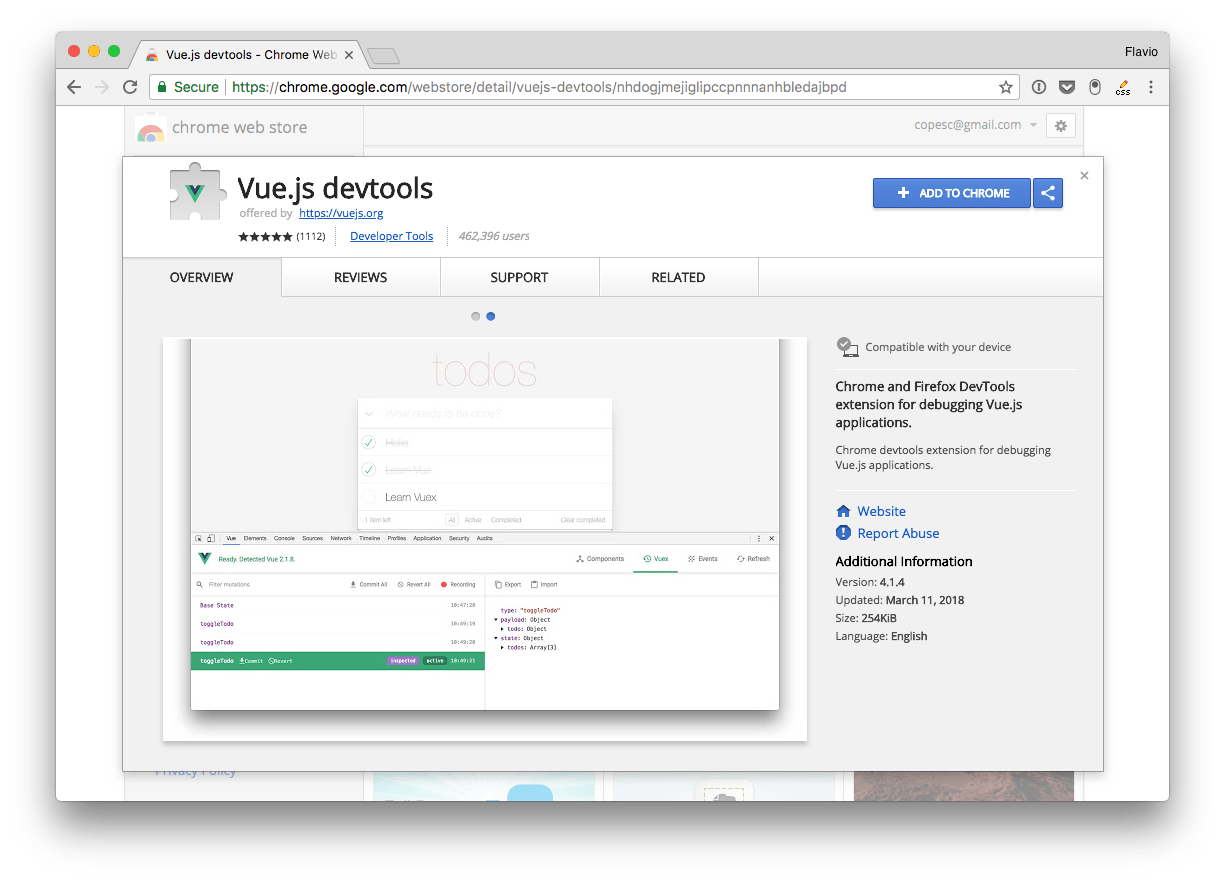
## Install on Chrome
Go to this page on the Google Chrome Store: <https://chrome.google.com/webstore/detail/vuejs-devtools/nhdogjmejiglipccpnnnanhbledajbpd> and click **Add to Chrome**.
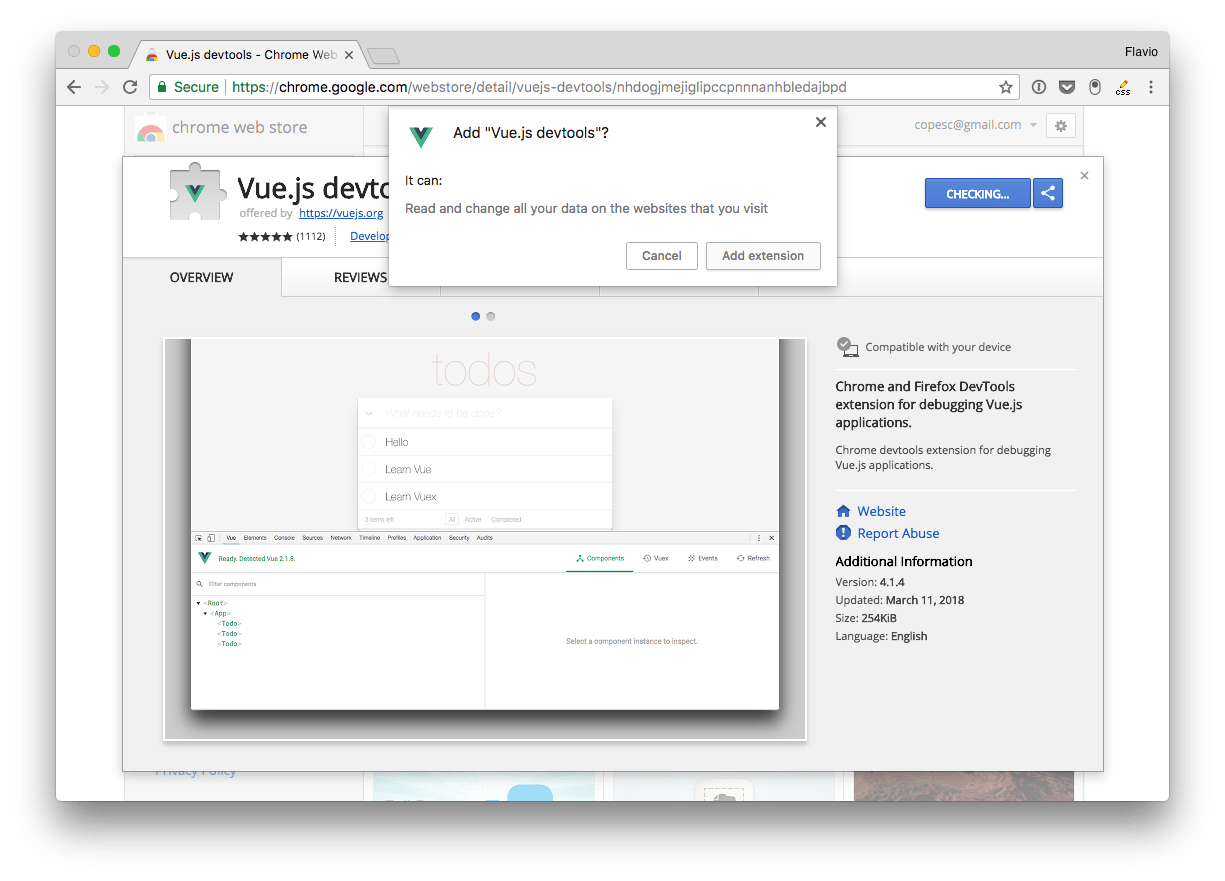
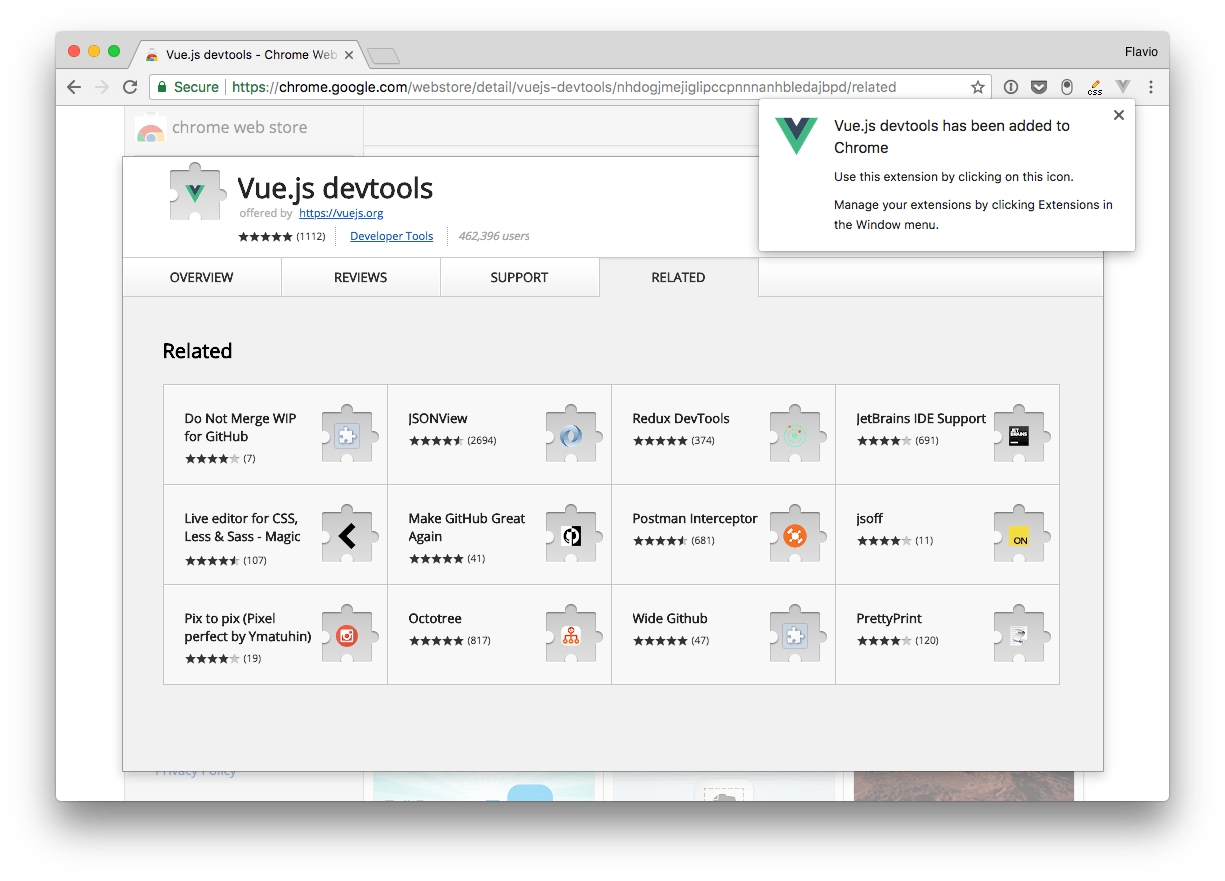
Go through the installation process:
The Vue.js devtools icon shows up in the toolbar. If the page does not have a Vue.js instance running, it's grayed out.
If Vue.js is detected, the icon has the Vue logo colors.
The icon does nothing except showing us that there *is* a Vue.js instance. To use the devtools, we must open the Developer Tools panel, using "View → Developer → Developer Tools", or `Cmd-Alt-i`
## Install on Firefox
You can find the Firefox dev tools extension in the Mozilla addons store: <https://addons.mozilla.org/en-US/firefox/addon/vue-js-devtools/>
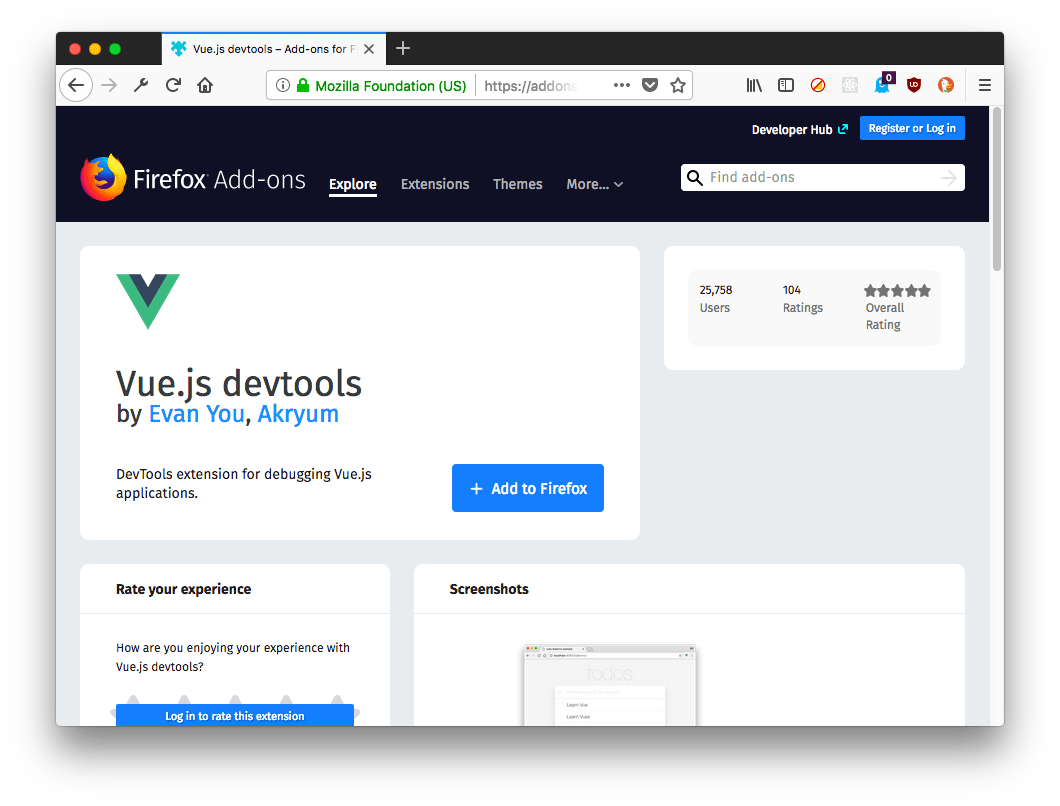
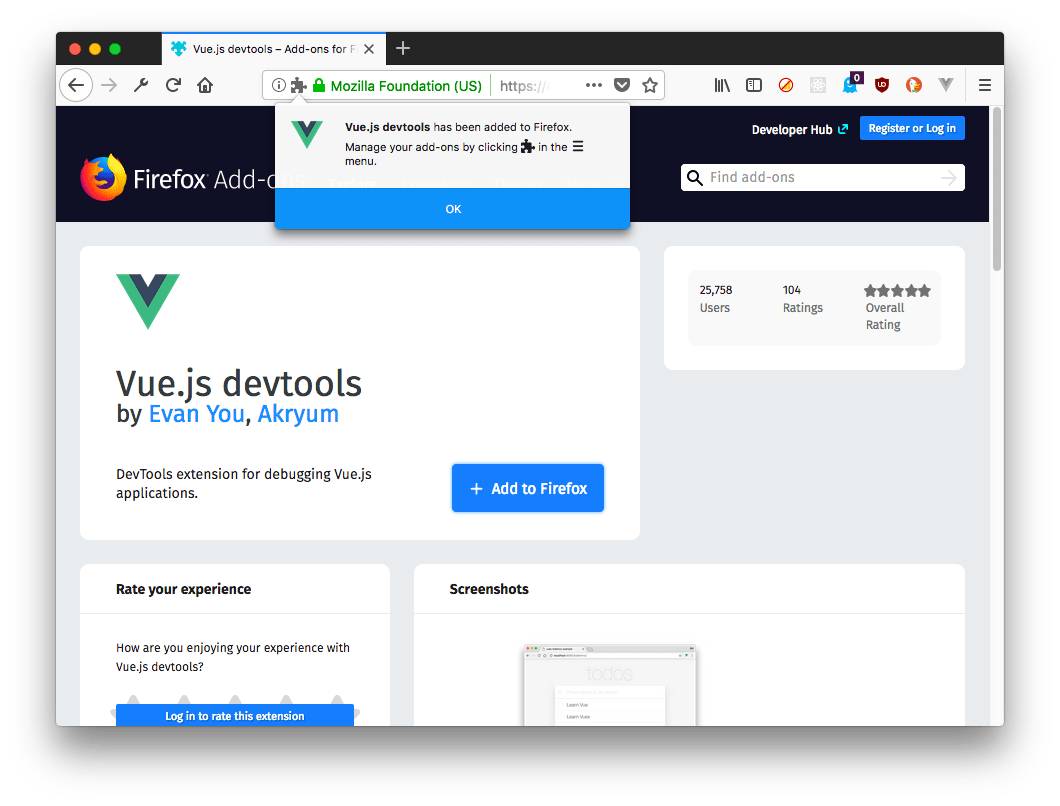
Click "**Add to Firefox**" and the extension will be installed. As with Chrome, a grayed icon shows up in the toolbar
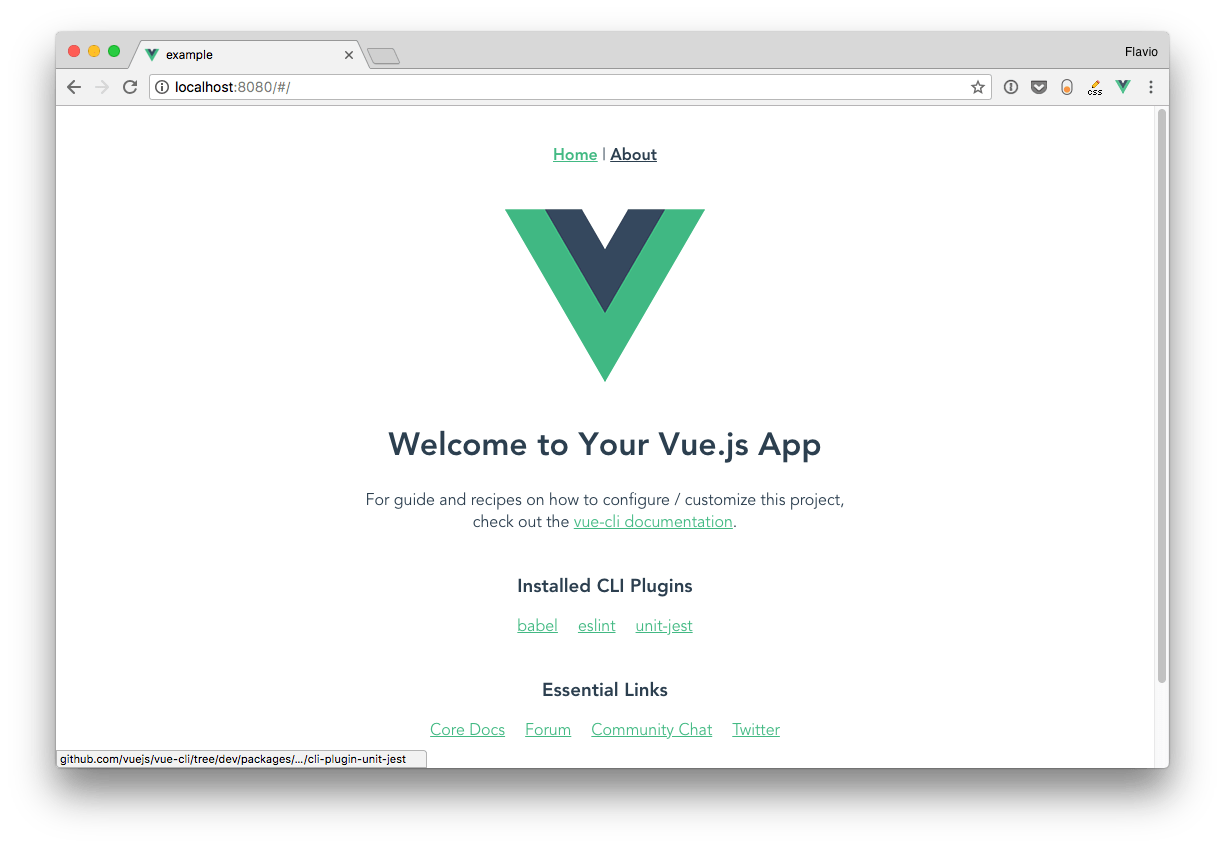
And when you visit a site that has a Vue instance running, it will become green, and when we open the Dev Tools we will see a "**Vue**" panel:
## Install the standalone app
Alternatively, you can use the DevTools standalone app.
Simply install it using
```
npm install -g @vue/devtools
//or
yarn global add @vue/devtools
```
and run it by calling
```
vue-devtools
```
This will open the standalone Electron-based application.
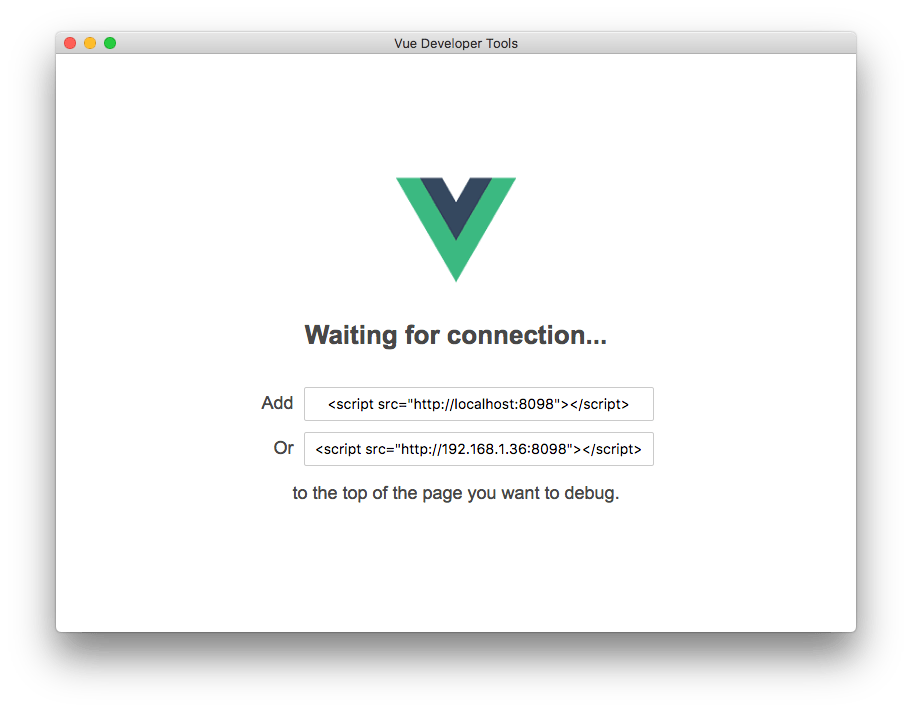
now, paste the script tag it shows you:
```
<script src="http://localhost:8098"></script>
```
inside the project `index.html` file, and wait for the app to be reloaded, and it will automatically connect to the app:
## How to use the Developer Tools
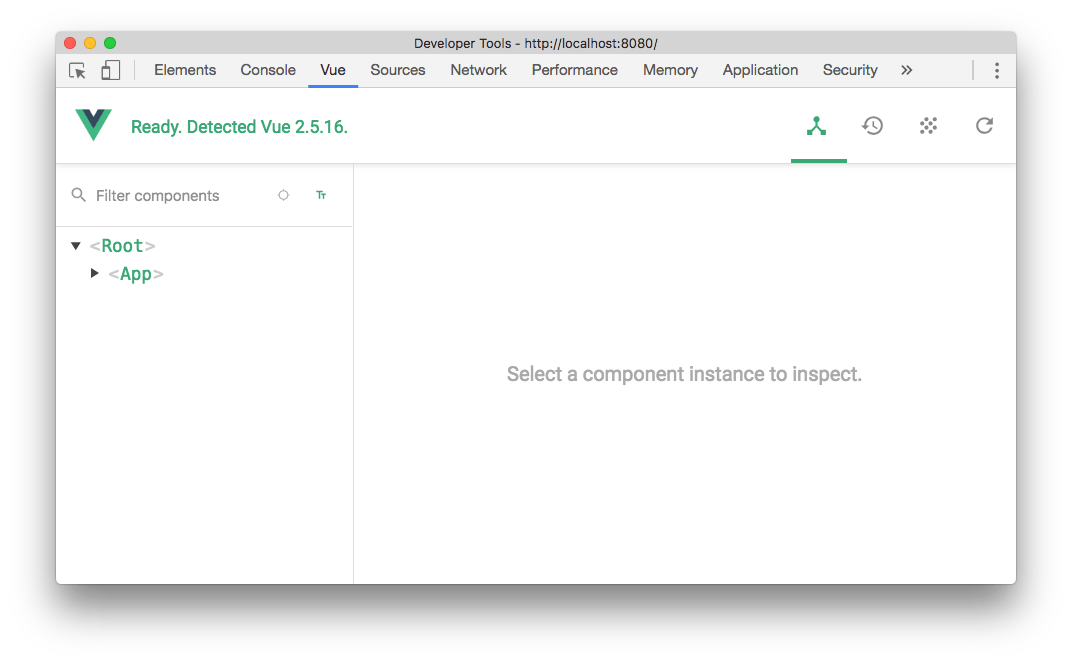
As mentioned, the Vue DevTools can be activated by opening the Developer Tools in the browser and moving to the Vue panel.
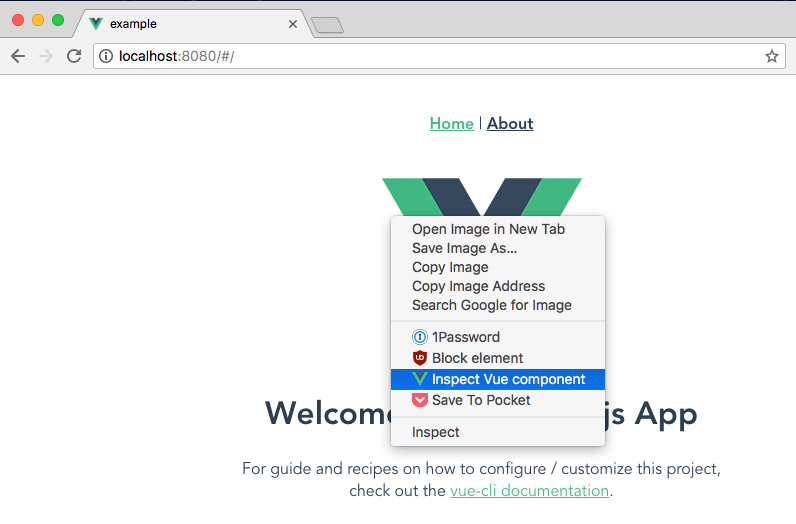
Another option is to right-click on any element in the page, and choose "Inspect Vue component":
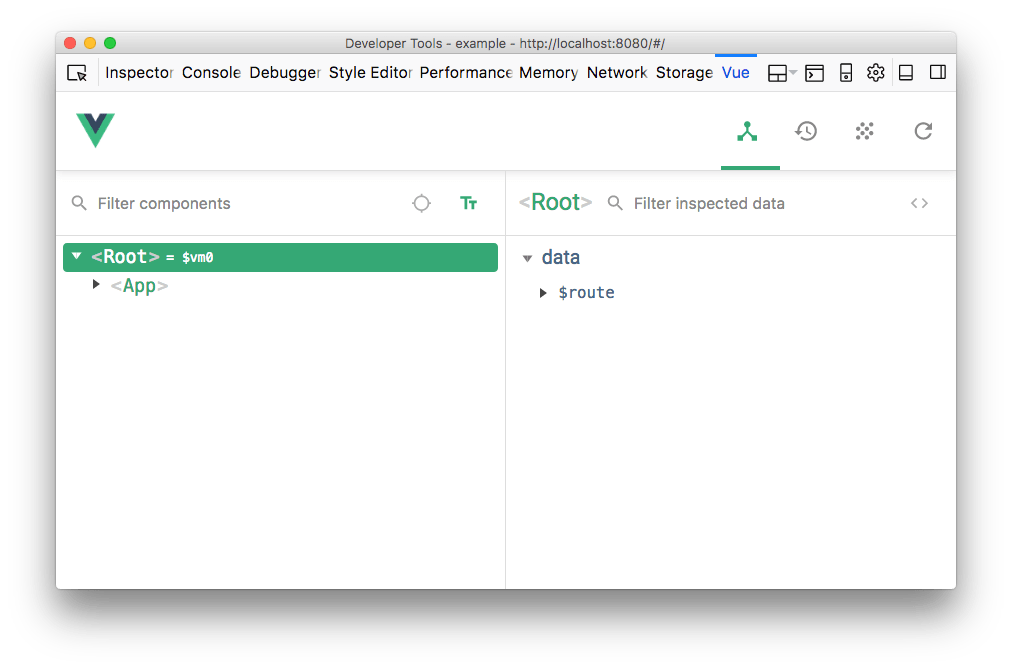
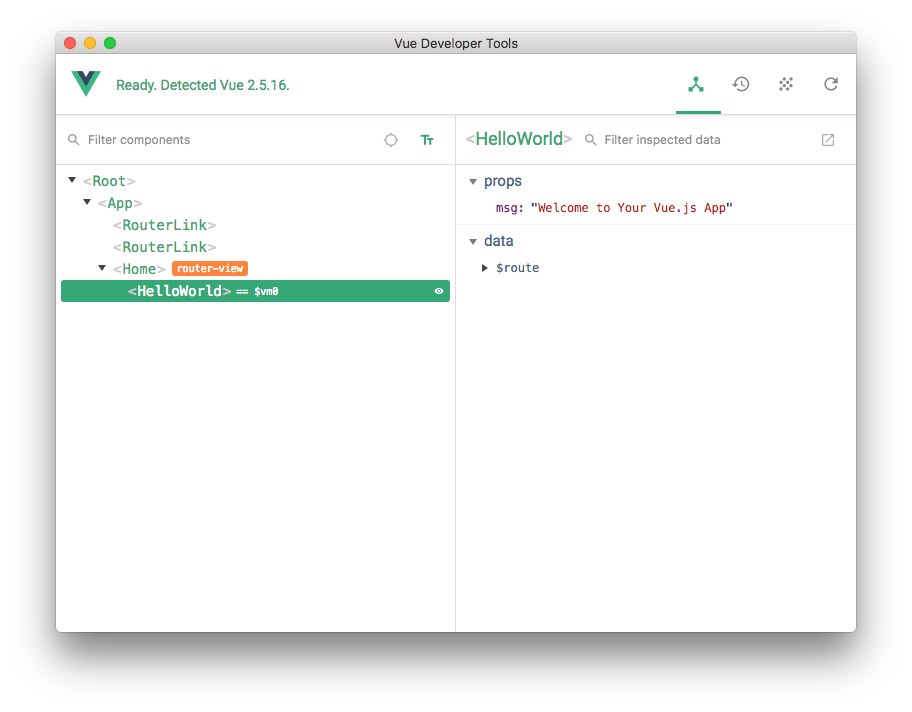
When the Vue DevTools panel is open, we can navigate the components tree. When we choose a component from the list on the left, the right panel shows the props and data it holds:
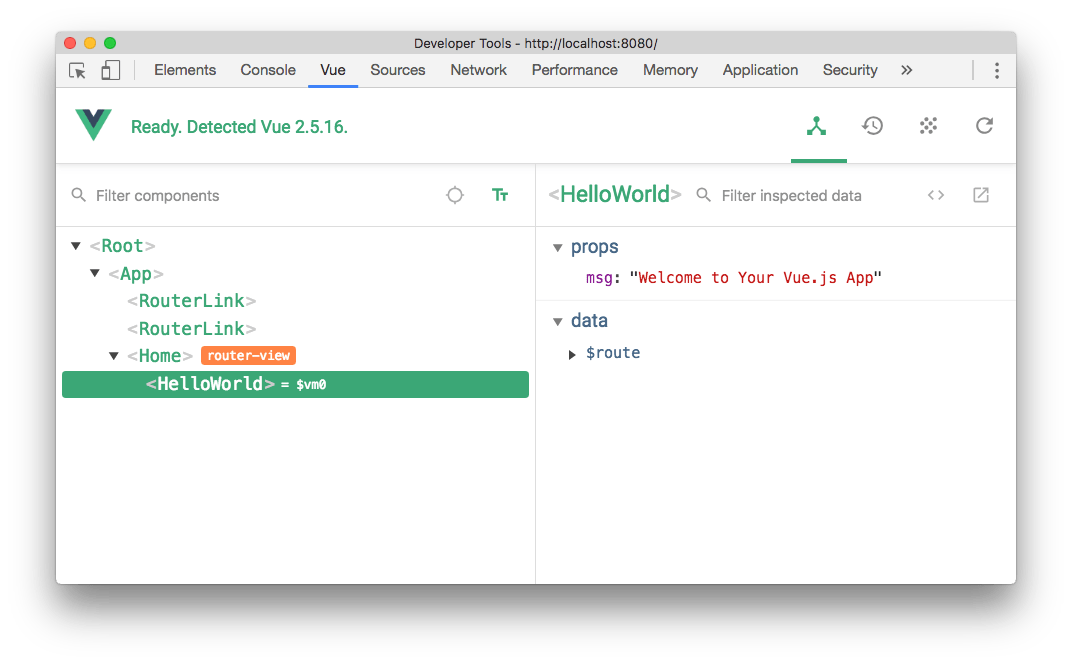
On the top there are 4 buttons:
- **Components** (the current panel), which lists all the component instances running in the current page. Vue can have multiple instances running at the same time, for example it might manage your shopping cart widget and the slideshow, with separate, lightweight apps.
- **Vuex** is where you can inspect the state managed through [Vuex](../vuex).
- **Events** shows all the events emitted
- **Refresh** reloads the devtools panel
Notice the small `= $vm0` text beside a component? It's a handy way to inspect a component using the Console. Pressing the "esc" key shows up the console in the bottom of the devtools, and you can type `$vm0` to access the Vue component:
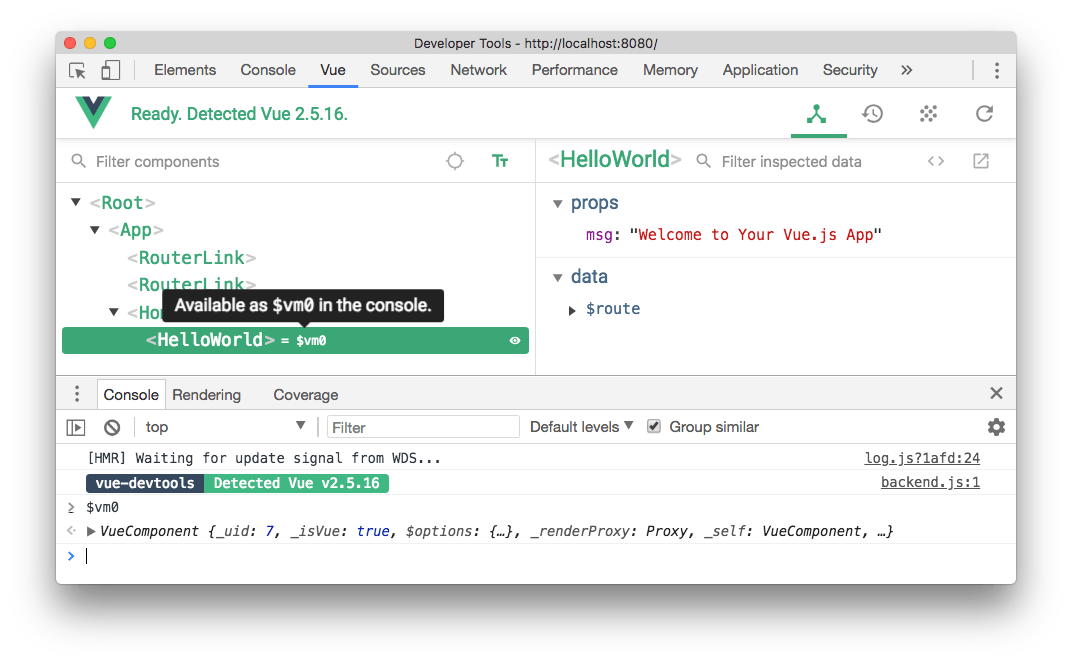
This is very cool to inspect and interact with components without having to assign them to a global variable in the code.
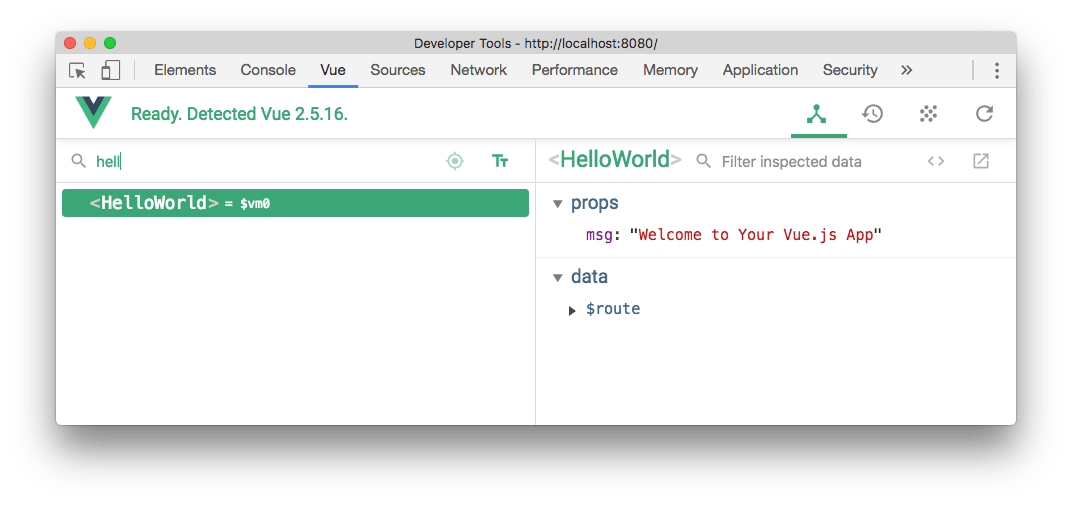
### Filter components
Start typing a component name, and the components tree will filter out the ones that don't match.
### Select component in the page
Click the

button and you can hover any component in the page with the mouse, click it, and it will be opened in the devtools.
### Format components names
You can choose to show components in camelCase or use dashes.
### Filter inspected data
On the right panel, you can type any word to filter the properties that don't match it.
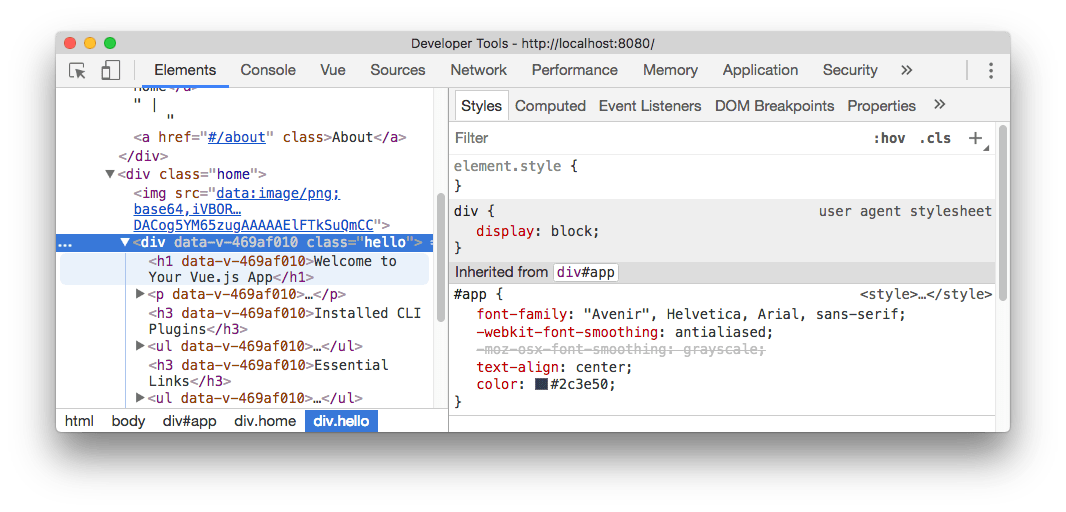
### Inspect DOM
Click the Inspect DOM button to be brought to the DevTools Elements inspector, with the DOM element generated by the component:
### Open in editor
Any user component (not framework-level components) has a button that opens it in your default editor. Very handy.
- Introduction
- Introduction to Vue
- Vue First App
- DevTools
- Configuring VS Code for Vue Development
- Components
- Single File Components
- Templates
- Styling components using CSS
- Directives
- Events
- Methods vs Watchers vs Computed Properties
- Props
- Slots
- Vue CLI
- 兼容IE
- Vue Router
- Vuex
- 组件设计
- 组件之间的通信
- 预渲染技术
- Vue 中的动画
- FLIP
- lottie
- Unit test
- Vue3 新特性
- Composition API
- Reactivity
- 使用 typescript
- 知识点
- 附录
- 问题
- 源码解析
- 资源