[TOC]
就是感觉梳理一下相关的可视化 JS 内容
# 工作要求
3. 前端框架 react 的相关 可视化
4. 熟悉Web的图形渲染技术(SVG、Canvas、WebGL),了解**计算机图形学基础理论及算法**
5. 熟悉一种图形库的使用(如g2、HighCharts 、ECharts 、D3 、Three.js)
组件等;
6. 独立作品 • 游戏、动画或者3D相关的开发经验
7. 大数据可视化大屏开发的经验
**What you will learn from this book**
* Creating graphics in Canvas 2D and draw complex shapes
* Building most of the common charts through step-by-step recipes
* Adding interactivity to canvas elements and create your own JavaScript animation engine
* Discovering many fantastic charting solutions and learn how to deal with their capabilities and how to change them as well
* Learning how to work with Google maps , Google Charts, and Google Docs API
* Integrating your data into live data, xml driven data, objects, and strings
[https://www.dogedoge.com/results?q=Data+Visualization+with+JavaScript](https://www.dogedoge.com/results?q=Data+Visualization+with+JavaScript)
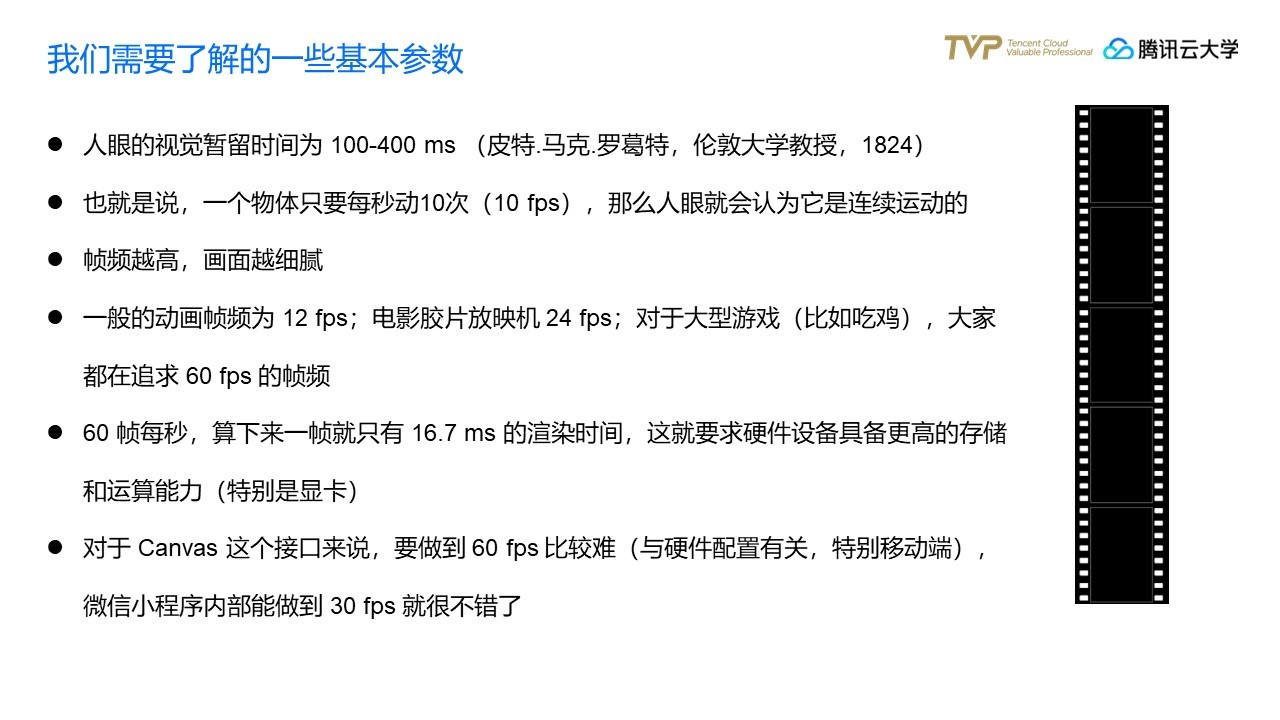
# 追求 60 fps 的极致体验

