
[TOC]
### Configuring Monitoring for Logstash Nodes
> <font color=#DC143C size=4>NOTE</font>:X-Pack特性,先不做翻译。以下是原文。
To monitor Logstash nodes:
1. Identify where to send monitoring data. This cluster is often referred to as the *production cluster*. For examples of typical monitoring architectures, see [How Monitoring Works](https://www.elastic.co/guide/en/elastic-stack-overview/6.5/how-monitoring-works.html).
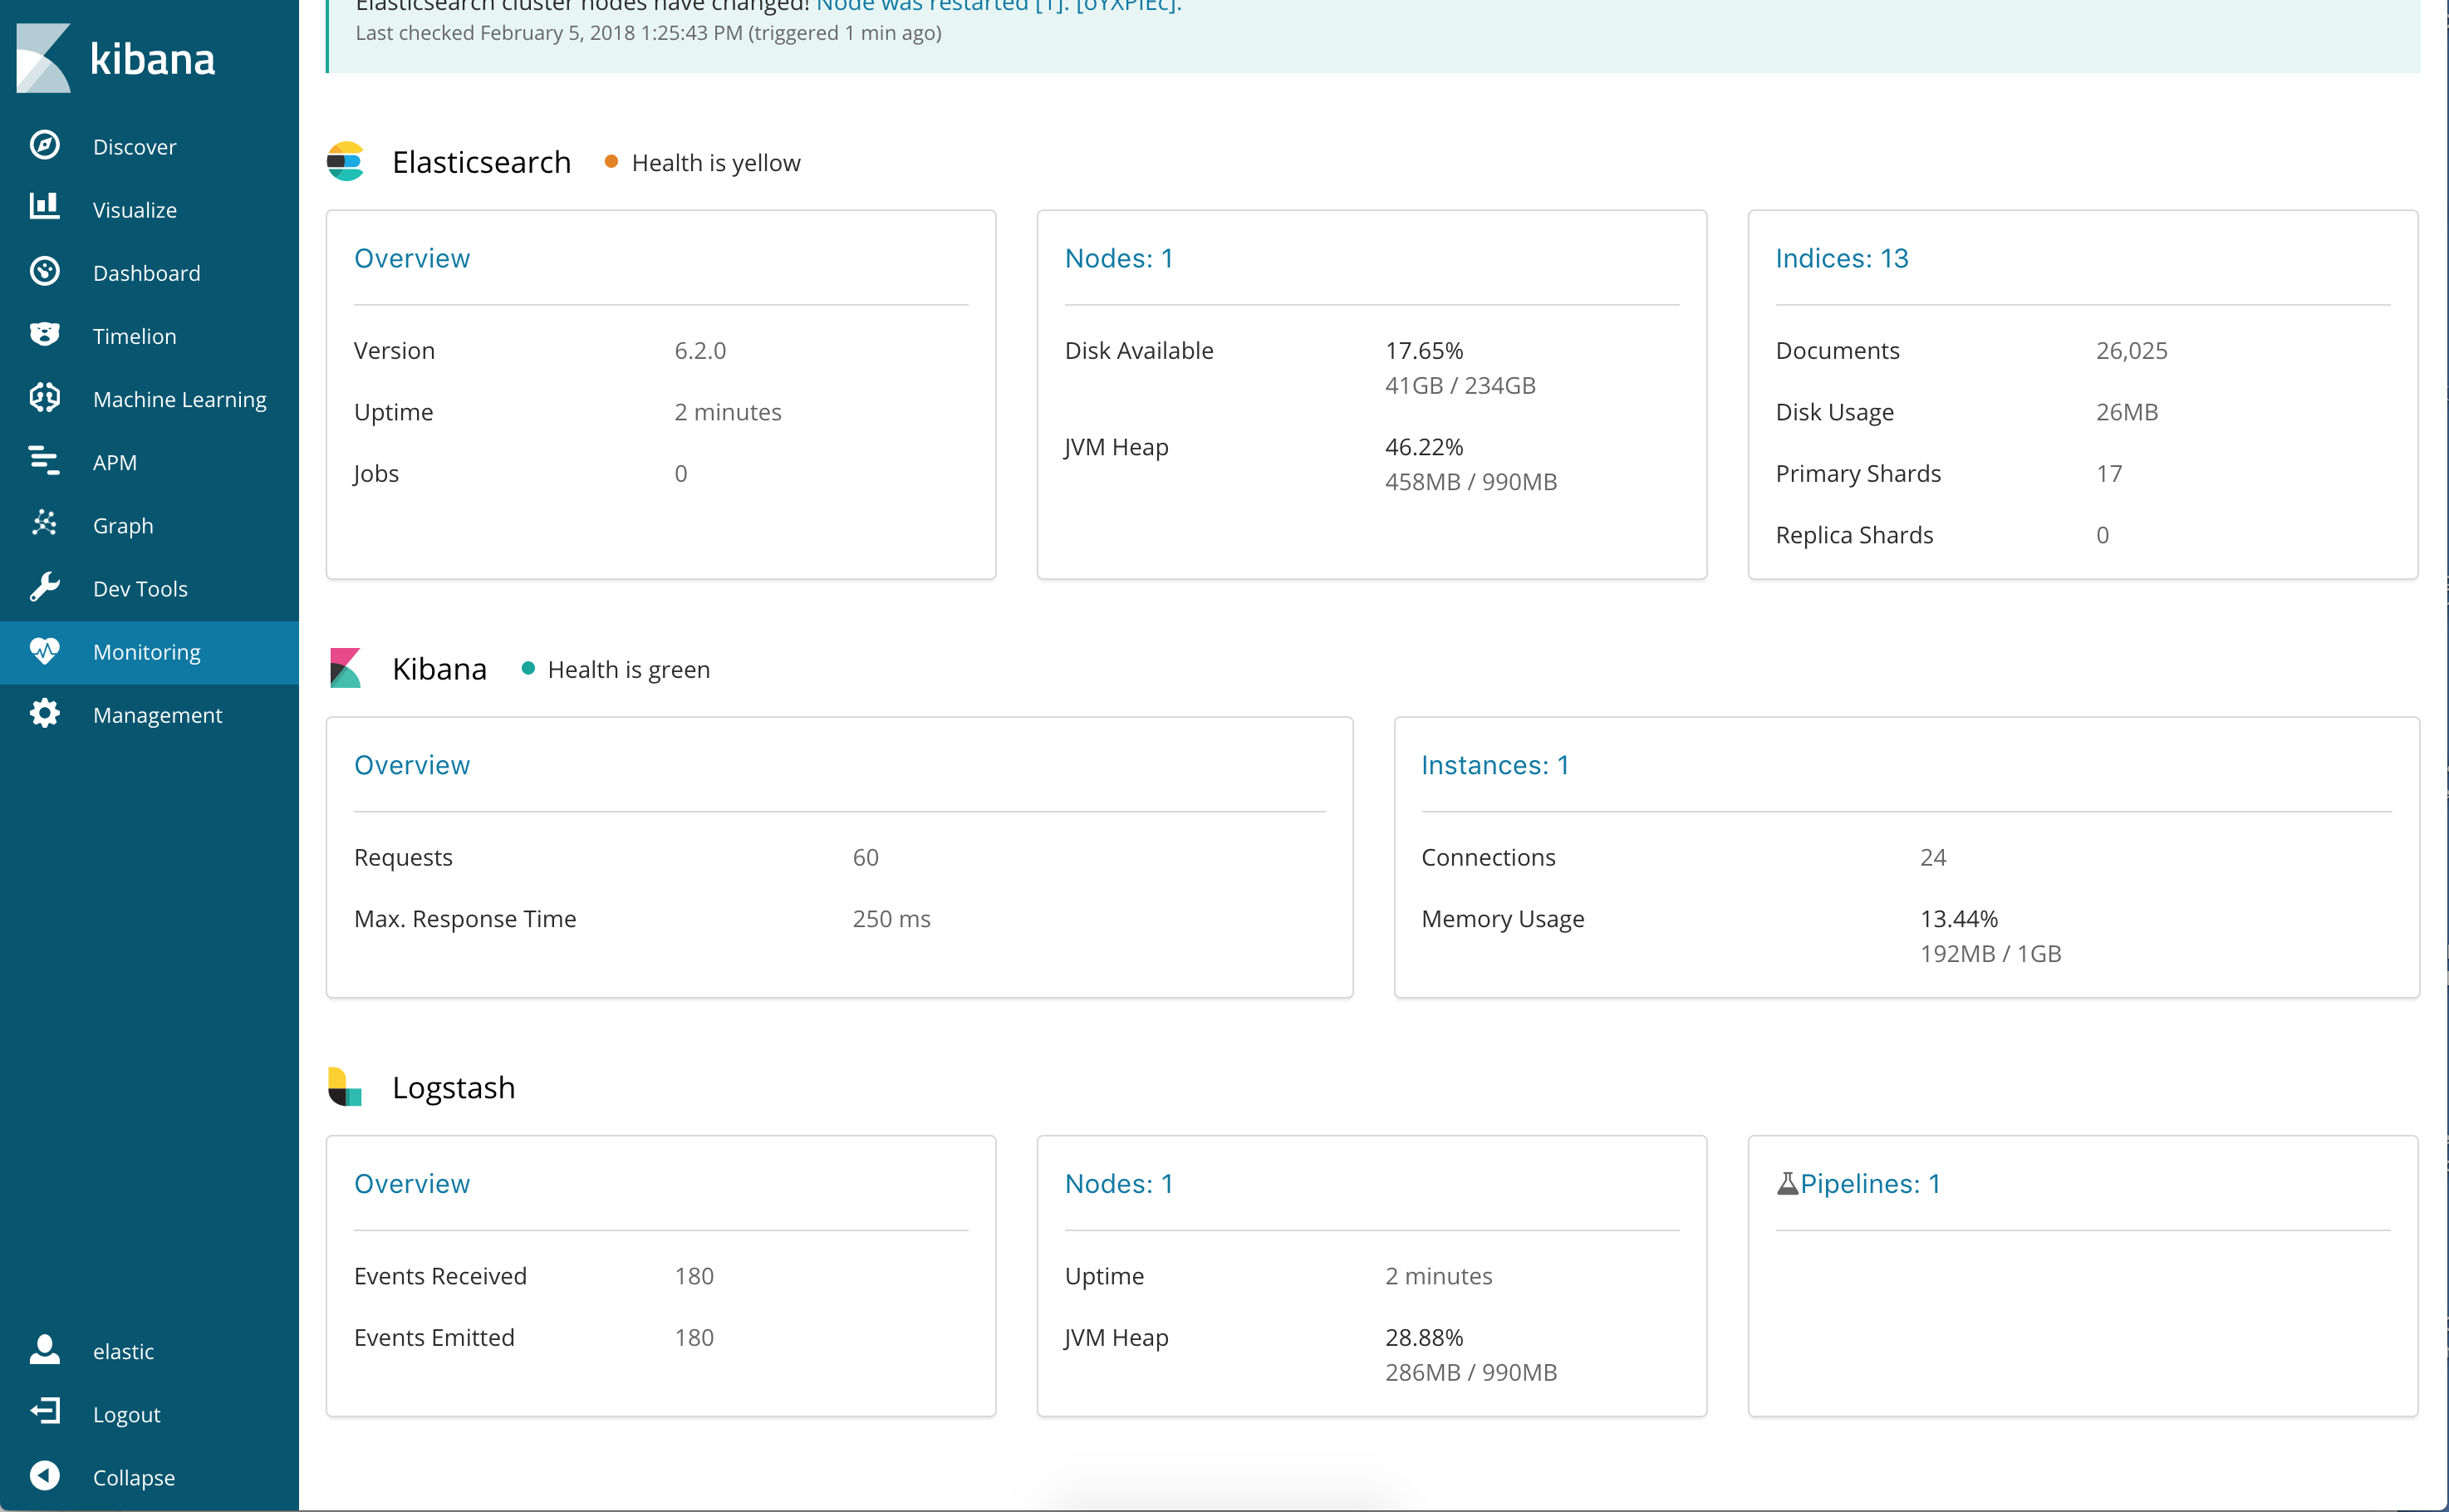
> To visualize Logstash as part of the Elastic Stack (as shown in Step
> 6), send metrics to your *production* cluster. Sending metrics to a dedicated
> monitoring cluster will show the Logstash metrics under the *monitoring* cluster.
2. Verify that the `xpack.monitoring.collection.enabled` setting is `true` on the
production cluster. If that setting is `false`, the collection of monitoring data
is disabled in Elasticsearch and data is ignored from all other sources.
3. Configure your Logstash nodes to send metrics by setting the
`xpack.monitoring.elasticsearch.url` in `logstash.yml`. If X-Pack security is enabled,
you also need to specify the credentials for the
[built-in `logstash_system` user](https://www.elastic.co/guide/en/elastic-stack-overview/6.5/built-in-users.html). For more information about these settings, see [Monitoring Settings](https://www.elastic.co/guide/en/logstash/6.5/configuring-logstash.html#monitoring-settings).
```
xpack.monitoring.elasticsearch.url:
["http://es-prod-node-1:9200", "http://es-prod-node-2:9200"] ①
xpack.monitoring.elasticsearch.username: "logstash_system" ②
xpack.monitoring.elasticsearch.password: "changeme"
```
① If SSL/TLS is enabled on the production cluster, you must connect through HTTPS. As of v5.2.1, you can specify multiple Elasticsearch hosts as an array as well as specifying a single host as a string. If multiple URLs are specified, Logstash can round-robin requests to these production nodes.
② If X-Pack security is disabled on the production cluster, you can omit these
`username` and `password` settings.
4. If SSL/TLS is enabled on the production Elasticsearch cluster, specify the trusted CA certificates that will be used to verify the identity of the nodes in the cluster.
To add a CA certificate to a Logstash node’s trusted certificates, you can specify the location of the PEM encoded certificate with the `ca` setting:
```yaml
xpack.monitoring.elasticsearch.ssl.ca: /path/to/ca.crt
```
Alternatively, you can configure trusted certificates using a truststore (a Java Keystore file that contains the certificates):
```yaml
xpack.monitoring.elasticsearch.ssl.truststore.path: /path/to/file
xpack.monitoring.elasticsearch.ssl.truststore.password: password
```
Also, optionally, you can set up client certificate using a keystore (a Java Keystore file that contains the certificate):
```yaml
xpack.monitoring.elasticsearch.ssl.keystore.path: /path/to/file
xpack.monitoring.elasticsearch.ssl.keystore.password: password
```
Set sniffing to `true` to enable discovery of other nodes of the elasticsearch cluster. Defaults to `false`.
```yaml
xpack.monitoring.elasticsearch.sniffing: false
```
5. Restart your Logstash nodes.
6. To verify your X-Pack monitoring configuration, point your web browser at your Kibana
host, and select **Monitoring** from the side navigation. Metrics reported from
your Logstash nodes should be visible in the Logstash section. When security is
enabled, to view the monitoring dashboards you must log in to Kibana as a user
who has the `kibana_user` and `monitoring_user` roles.
#### Re-enabling Logstash Monitoring After Upgrading
When upgrading from older versions of X-Pack, the built-in `logstash_system`
user is disabled for security reasons. To resume monitoring,
[change the password and re-enable the logstash_system user](https://www.elastic.co/guide/en/logstash/6.5/monitoring-troubleshooting.html).
### Monitoring Settings in Logstash
You can set the following `xpack.monitoring` settings in `logstash.yml` to
control how monitoring data is collected from your Logstash nodes. However, the
defaults work best in most circumstances. For more information about configuring
Logstash, see [logstash.yml](https://www.elastic.co/guide/en/logstash/6.5/logstash-settings-file.html).
##### General Monitoring Settings
- `xpack.monitoring.enabled`
Monitoring is disabled by default. Set to `true` to enable X-Pack monitoring.
- `xpack.monitoring.elasticsearch.url`
The Elasticsearch instances that you want to ship your Logstash metrics to. This might be the same Elasticsearch instance specified in the `outputs` section in your Logstash configuration, or a different one. This is **not** the URL of your dedicated monitoring cluster. Even if you are using a dedicated monitoring cluster, the Logstash metrics must be routed through your production cluster. You can specify a single host as a string, or specify multiple hosts as an array. Defaults to `http://localhost:9200`.
- `xpack.monitoring.elasticsearch.username` and `xpack.monitoring.elasticsearch.password`
If your Elasticsearch is protected with basic authentication, these settings provide the username and password that the Logstash instance uses to authenticate for shipping monitoring data.
#### Monitoring Collection Settings
`xpack.monitoring.collection.interval`
Controls how often data samples are collected and shipped on the Logstash side. Defaults to `10s`. If you modify the collection interval, set the `xpack.monitoring.min_interval_seconds` option in `kibana.yml` to the same value.
##### X-Pack monitoring TLS/SSL Settings
You can configure the following Transport Layer Security (TLS) or Secure Sockets Layer (SSL) settings. For more information, see [Configuring Credentials for Logstash Monitoring](https://www.elastic.co/guide/en/logstash/6.5/ls-security.html#ls-monitoring-user)[edit](https://github.com/elastic/logstash/edit/6.5/docs/static/security/logstash.asciidoc).
- `xpack.monitoring.elasticsearch.ssl.ca`
Optional setting that enables you to specify a path to the `.pem` file for the certificate authority for your Elasticsearch instance.
- `xpack.monitoring.elasticsearch.ssl.truststore.path`
Optional settings that provide the paths to the Java keystore (JKS) to validate the server’s certificate.
- `xpack.monitoring.elasticsearch.ssl.truststore.password`
Optional settings that provide the password to the truststore.
- `xpack.monitoring.elasticsearch.ssl.keystore.path`
Optional settings that provide the paths to the Java keystore (JKS) to validate the client’s certificate.
- `xpack.monitoring.elasticsearch.ssl.keystore.password`
Optional settings that provide the password to the keystore.
- Emmm
- Logstash简介
- 开始使用Logstash
- 安装Logstash
- 储存你的第一个事件
- 通过Logstash解析日志
- 多个输入和输出插件的混合使用
- Logstash是如何工作的
- 执行模型Execution Model
- 设置并运行Logstash
- Logstash目录布局
- Logstash配置文件
- logstash.yml
- Secrets keystore for secure settings
- 从命令行运行Logstash
- 以服务的方式运行Logstash
- 在Docker中运行Logstash
- 配置容器版Logstash
- Logging
- 关闭Logstash
- 安装X-Pack
- 设置X-Pack
- 升级Logstash
- 使用包管理升级
- 直接下载进行升级
- 升级至6.0
- Upgrading with the Persistent Queue Enabled
- 配置Logstash
- 管道配置文件的结构
- 访问配置中的事件数据和字段
- 在配置中使用环境变量
- Logstash配置示例
- 多管道
- 管道间通信(beta)
- 重载配置文件
- 管理多行事件
- Glob Pattern Support
- Converting Ingest Node Pipelines
- Logstash间通信
- 配置集中式管道管理
- X-Pack Monitoring
- X-Pack Security
- X-Pack Settings
- Field References Deep Dive(深入字段引用)
- 管理Logstash
- 集中式管道管理
- 使用Logstash模块
- 使用Elastic Cloud
- Logstash ArcSight模块