[TOC]
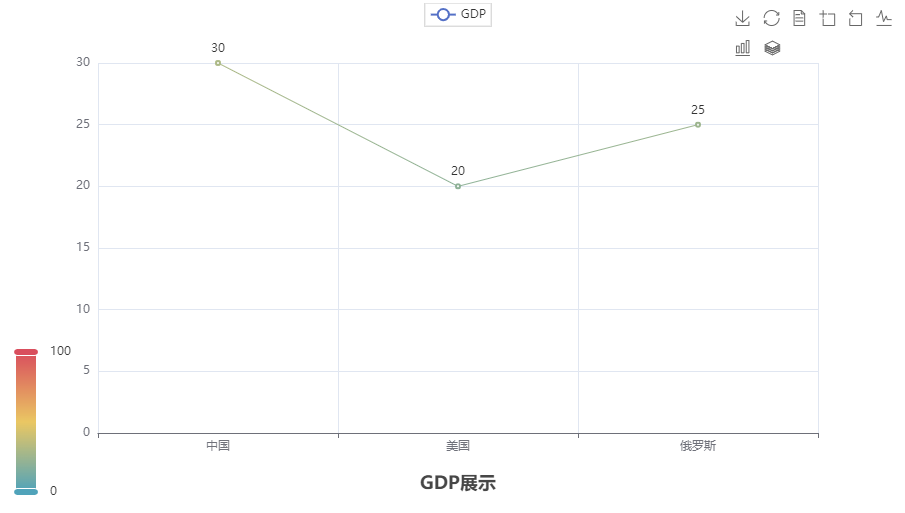
# 折线图
~~~python
from pyecharts.charts import Line
from pyecharts.options import TitleOpts, LegendOpts, ToolboxOpts, VisualMapOpts
# 构建折线图对象
line = Line()
line.add_xaxis(["中国", '美国', "俄罗斯"]) # 填充X轴数据
line.add_yaxis("GDP", [30, 20, 25]) # 填充Y轴数据
# 设置全局配置
line.set_global_opts(
title_opts=TitleOpts(title="GDP展示", pos_left="center", pos_bottom="1%"), # 标题,标题位置
legend_opts=LegendOpts(is_show=True), # 显示图例
toolbox_opts=ToolboxOpts(is_show=True), # 显示工具箱
visualmap_opts=VisualMapOpts(is_show=True) # 视觉映射
)
// 绘制折线图
line.render("折线图.html")
~~~

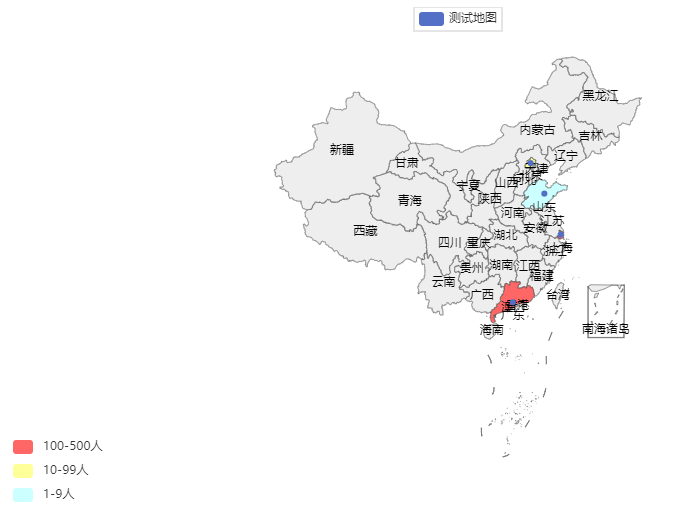
# 数据可视化地图
~~~python
from pyecharts.charts import Map
from pyecharts.options import VisualMapOpts
map = Map()
data = [
("北京", 99),
("上海", 199),
("广东", 150),
("深圳", 120),
("山东", 6),
]
name_map = {"北京市": "北京",
"浙江省": "浙江",
"天津市": "天津",
"安徽省": "安徽",
"上海市": "上海",
"福建省": "福建",
"重庆市": "重庆",
"江西省": "江西",
"香港特别行政区": "香港",
"澳门特别行政区": "澳门",
"山东省": "山东",
"河南省": "河南",
"内蒙古自治区": "内蒙古",
"湖北省": "湖北",
"新疆维吾尔自治区": "新疆",
"湖南省": "湖南",
"宁夏回族自治区": "宁夏",
"广东省": "广东",
"西藏自治区": "西藏",
"海南省": "海南",
"广西壮族自治区": "广西",
"四川省": "四川",
"河北省": "河北",
"贵州省": "贵州",
"山西省": "山西",
"云南省": "云南",
"辽宁省": "辽宁",
"陕西省": "陕西",
"吉林省": "吉林",
"甘肃省": "甘肃",
"黑龙江省": "黑龙江",
"青海省": "青海",
"江苏省": "江苏",
"台湾省": "台湾"}
map.add("测试地图", data, "china", name_map=name_map) # 标题,数据,国家,地区名称映射
map.set_global_opts(
visualmap_opts=VisualMapOpts(
is_show=True,
is_piecewise=True,
pieces=[
{"min": 1, "max": 9, "label": "1-9人", "color": "#CCFFFF"},
{"min": 10, "max": 99, "label": "10-99人", "color": "#FFFF99"},
{"min": 100, "max": 500, "label": "100-500人", "color": "#FF6666"}
]
)
)
map.render("地图.html")
~~~

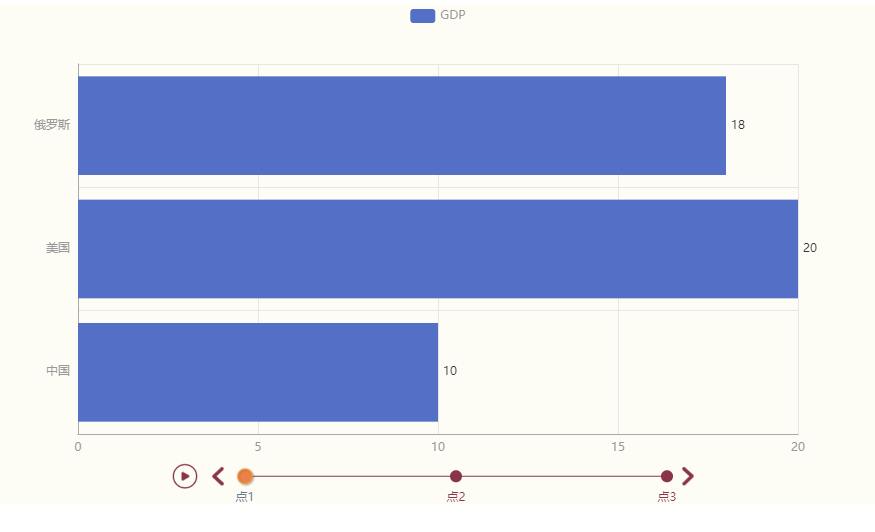
# 时间线-柱状图
~~~python
from peycharts.charts import Bar
from pyecharts.options import LabelOpts
from pyecharts.globals import ThemeType
bar1 = Bar()
bar1.add_xaxis(["中国", "美国", "俄罗斯"])
bar1.add_yaxis("GDP", [10, 20, 18], label_opts=LabelOpts(position="right")) # 数值靠右
bar1.reversal_axis()
bar2 = Bar()
bar2.add_xaxis(["中国", "美国", "俄罗斯"])
bar2.add_yaxis("GDP", [15, 35, 27], label_opts=LabelOpts(position="right")) # 数值靠右
bar2.reversal_axis()
bar3 = Bar()
bar3.add_xaxis(["中国", "美国", "俄罗斯"])
bar3.add_yaxis("GDP", [26, 40, 38], label_opts=LabelOpts(position="right")) # 数值靠右
bar3.reversal_axis()
# 构建时间线对象
timeLine = Timeline({"theme": ThemeType.ESSOS})
timeLine.add(bar1, "点1")
timeLine.add(bar2, "点2")
timeLine.add(bar3, "点3")
timeLine.add_schema(
play_interval=1000, # 自动播放的时间间隔,单位毫秒
is_timeline_show=True, # 是否在自动播放的时候,显示时间线
is_auto_play=True, # 是否自动播放
is_loop_play=True # 是否循环自动播放
)
timeLine.render("时间线图表.html")
~~~

- PHP
- PHP 核心架构
- PHP 生命周期
- PHP-FPM 详解
- PHP-FPM 配置优化
- PHP 命名空间和自动加载
- PHP 运行模式
- PHP 的 Buffer(缓冲区)
- php.ini 配置文件参数优化
- 常见面试题
- 常用函数
- 几种排序算法
- PHP - 框架
- Laravel
- Laravel 生命周期
- ThinkPHP
- MySQL
- 常见问题
- MySQL 索引
- 事务
- 锁机制
- Explain 使用分析
- MySQL 高性能优化规范
- UNION 与 UNION ALL
- MySQL报错:sql_mode=only_full_group_by
- MySQL 默认的 sql_mode 详解
- 正则表达式
- Redis
- Redis 知识
- 持久化
- 主从复制、哨兵、集群
- Redis 缓存击穿、穿透、雪崩
- Redis 分布式锁
- RedisBloom
- 网络
- 计算机网络模型
- TCP
- UDP
- HTTP
- HTTPS
- WebSocket
- 常见几种网络攻击方式
- Nginx
- 状态码
- 配置文件
- Nginx 代理+负载均衡
- Nginx 缓存
- Nginx 优化
- Nginx 配置 SSL 证书
- Linux
- 常用命令
- Vim 常用操作命令
- Supervisor 进程管理
- CentOS与Ubuntu系统区别
- Java
- 消息队列
- 运维
- RAID 磁盘阵列
- 逻辑分区管理 LVM
- 业务
- 标准通信接口设计
- 业务逻辑开发套路的三板斧
- 微信小程序登录流程
- 7种Web实时消息推送方案
- 用户签到
- 用户注册-短信验证码
- SQLServer 删除同一天用户重复签到
- 软件研发完整流程
- 前端
- Redux
- 其他
- 百度云盘大文件下载
- 日常报错记录
- GIT
- SSL certificate problem: unable to get local issuer certificate
- NPM
- reason: connect ECONNREFUSED 127.0.0.1:31181
- SVN
- SVN客户端无法连接SVN服务器,主机积极拒绝
- Python
- 基础
- pyecharts图表
- 对象
- 数据库
- PySpark
- 多线程
- 正则
- Hadoop
- 概述
- HDFS
