## LEDBarGraph
>
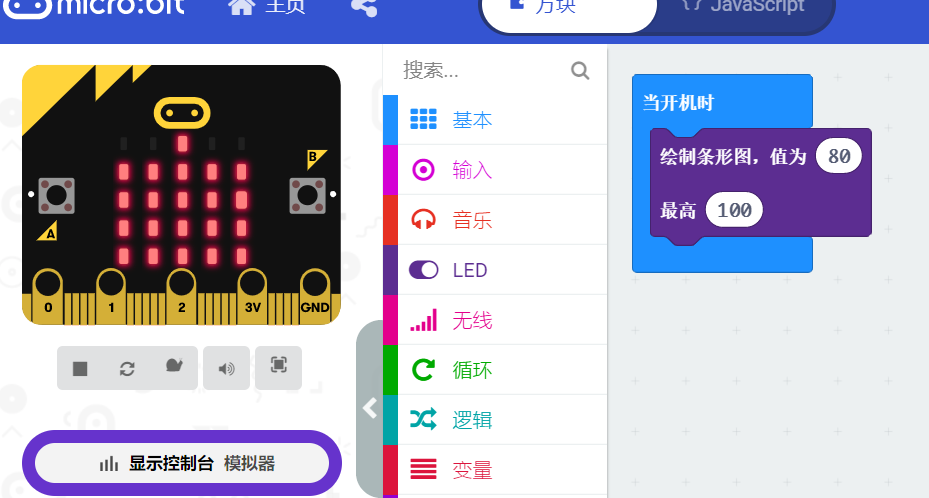
左上角的条状图就是这个类要实现的效果了,就是有若干个指示灯,用亮度来表示不同的范围。微软为microbit写的图形化编辑器makecode中也有类似的积木块:
利用`LEDBarGraph`类,我们可以把若干个LED灯的集合看做是一个条形图。
~~~
from gpiozero import LEDBarGraph
from time import sleep
from __future__ import division # required for python 2
graph = LEDBarGraph(5, 6, 13, 19, 26, 20)
graph.value = 1 # (1, 1, 1, 1, 1, 1)
sleep(1)
graph.value = 1/2 # (1, 1, 1, 0, 0, 0)
sleep(1)
graph.value = -1/2 # (0, 0, 0, 1, 1, 1)
sleep(1)
graph.value = 1/4 # (1, 0, 0, 0, 0, 0)
sleep(1)
graph.value = -1 # (1, 1, 1, 1, 1, 1)
sleep(1)
~~~
虽然本质上当`pwm=False`(默认)的时候,LED只有开和关两种状态。
但是在使用`LEDBarGraph`的时候,如果我们把pwm设置为真`pwm=True`,那么利用LED亮度来表示条形图会更加精确。
~~~
from gpiozero import LEDBarGraph
from time import sleep
from __future__ import division # required for python 2
graph = LEDBarGraph(5, 6, 13, 19, 26, pwm=True)
graph.value = 1/10 # (0.5, 0, 0, 0, 0)
sleep(1)
graph.value = 3/10 # (1, 0.5, 0, 0, 0)
sleep(1)
graph.value = -3/10 # (0, 0, 0, 0.5, 1)
sleep(1)
graph.value = 9/10 # (1, 1, 1, 1, 0.5)
sleep(1)
graph.value = 95/100 # (1, 1, 1, 1, 0.75)
sleep(1)
~~~
- 简介
- 更新树莓派源
- GPIO Zero基础案例
- 导入GPIO Zero库
- 引脚编码
- 树莓派代码编辑器
- LED
- 电磁继电器
- 呼吸灯
- LED条形图
- led条
- 交通灯
- 按钮
- 按钮控制LED灯
- 用按钮控制摄像头
- 舵机
- 关机按钮
- 按钮拍照
- 反应速度游戏
- 音乐盒子
- 单个按钮控制多个元件
- 全彩灯
- 人体红外传感器
- 亮度传感器
- 距离传感器
- 马达控制
- 机器人
- 按钮控制机器人
- 键盘控制机器人
- 红外感应机器人
- 电位器
- 用数模转换器测量温度
- 通过3个电位器控制全彩灯
- 时控加热灯
- 联网状态指示
- CPU温度条形图
- 更多
- OLED屏幕
- GPIO Zero基础案例2
- 古德微树莓派案例
- ws2812灯带python案例
- ads1115
- 高级秘籍
- 4 配置远程GPIO
- 5 远程GPIO案例
- 5.1 LED和按钮
- 6 树莓派Zero OTG USB数据线
- 7.数据源和值
- 微信发送疫情
- 8. 命令行工具
- 9. 常见问题
- 10. 从RPi.GPIO库迁移到GPIO Zero
- 公众号文章
- Python绘制疫情图表
- 百度人工智能案例
- vscode配置树莓派远程开发环境
- Jupyter Notebook相关
- 树莓派拍摄定格动画
- oled
- 创客与音乐
- 如何入门Python
- 交通标志