
[TOC]
## 监控集群节点
要监控节点其实我们已经有很多非常成熟的方案了,比如 Nagios、zabbix,甚至我们自己来收集数据也可以,我们这里通过 Prometheus 来采集节点的监控指标数据,可以通过 [node_exporter](https://github.com/prometheus/node_exporter) 来获取,顾名思义,`node_exporter` 就是抓取用于采集服务器节点的各种运行指标,目前 `node_exporter` 支持几乎所有常见的监控点,比如 conntrack,cpu,diskstats,filesystem,loadavg,meminfo,netstat 等,详细的监控点列表可以参考其 [Github 仓库](https://github.com/prometheus/node_exporter)。
我们可以通过 DaemonSet 控制器来部署该服务,这样每一个节点都会自动运行一个这样的 Pod,如果我们从集群中删除或者添加节点后,也会进行自动扩展。
在部署 `node-exporter` 的时候有一些细节需要注意,如下资源清单文件:(prometheus-node-exporter.yaml)
```yaml
cat <<'EOF' | kubectl apply -f -
apiVersion: apps/v1
kind: DaemonSet
metadata:
name: node-exporter
namespace: kube-system
spec:
selector:
matchLabels:
app.kubernetes.io/instance: node-exporter
updateStrategy:
rollingUpdate:
maxUnavailable: 1
type: RollingUpdate
template:
metadata:
labels:
app.kubernetes.io/instance: node-exporter
spec:
securityContext:
fsGroup: 65534
runAsGroup: 65534
runAsNonRoot: true
runAsUser: 65534
containers:
- name: node-exporter
image: quay.io/prometheus/node-exporter:v1.7.0
imagePullPolicy: IfNotPresent
args:
- --path.procfs=/host/proc
- --path.sysfs=/host/sys
- --path.rootfs=/host/root
- --collector.filesystem.fs-types-exclude=^(tmpfs|devtmpfs|cgroup2|overlay)$
securityContext:
readOnlyRootFilesystem: true
ports:
- name: metrics
containerPort: 9100
protocol: TCP
livenessProbe:
failureThreshold: 3
httpGet:
httpHeaders:
path: /
port: 9100
scheme: HTTP
initialDelaySeconds: 0
periodSeconds: 10
successThreshold: 1
readinessProbe:
failureThreshold: 3
httpGet:
httpHeaders:
path: /
port: 9100
scheme: HTTP
initialDelaySeconds: 0
periodSeconds: 10
successThreshold: 1
volumeMounts:
- name: proc
mountPath: /host/proc
readOnly: true
- name: sys
mountPath: /host/sys
readOnly: true
- name: root
mountPath: /host/root
mountPropagation: HostToContainer
readOnly: true
hostNetwork: true
hostPID: true
nodeSelector:
kubernetes.io/os: linux
tolerations:
- operator: Exists
volumes:
- name: proc
hostPath:
path: /proc
- name: sys
hostPath:
path: /sys
- name: root
hostPath:
path: /
EOF
```
由于我们要获取到的数据是主机的监控指标数据,而我们的 `node-exporter` 是运行在容器中的,所以我们在 Pod 中需要配置一些 Pod 的安全策略,这里我们就添加了 `hostPID: true`、`hostIPC: true`、`hostNetwork: true` 3个策略,用来使用主机的 `PID namespace`、`IPC namespace` 以及主机网络,这些 namespace 就是用于容器隔离的关键技术,要注意这里的 namespace 和集群中的 namespace 是两个完全不相同的概念。
另外我们还将主机的 `/dev`、`/proc`、`/sys`这些目录挂载到容器中,这些因为我们采集的很多节点数据都是通过这些文件夹下面的文件来获取到的,比如我们在使用 `top` 命令可以查看当前 cpu 使用情况,数据就来源于文件 `/proc/stat`,使用 `free` 命令可以查看当前内存使用情况,其数据来源是来自 `/proc/meminfo` 文件。
```shell
$ kubectl apply -f node-exporter.yaml
daemonset.apps/node-exporter create
$ kubectl get pods -n kube-mon -l app=node-exporter -o wide
NAME READY STATUS RESTARTS AGE IP NODE NOMINATED NODE READINESS GATES
node-exporter-q42fg 1/1 Running 0 16m 172.20.0.14 k8s-master <none> <none>
node-exporter-r54ds 1/1 Running 1 22h 172.20.0.13 k8s-node01 <none> <none>
node-exporter-tdwgt 1/1 Running 1 22h 172.20.0.9 k8s-node02 <none> <none>
```
## 验证
部署完成后,我们可以看到在3个节点上都运行了一个 Pod,由于我们指定了 `hostNetwork=true`,所以在每个节点上就会绑定一个端口 9100,我们可以通过这个端口去获取到监控指标数据:
```shell
$ curl 172.20.0.14:9100/metrics
# HELP go_gc_duration_seconds A summary of the pause duration of garbage collection cycles.
# TYPE go_gc_duration_seconds summary
go_gc_duration_seconds{quantile="0"} 0.098513621
go_gc_duration_seconds{quantile="0.25"} 0.098513621
go_gc_duration_seconds{quantile="0.5"} 0.098513621
go_gc_duration_seconds{quantile="0.75"} 0.098513621
go_gc_duration_seconds{quantile="1"} 0.098513621
go_gc_duration_seconds_sum 0.098513621
go_gc_duration_seconds_count 1
```
## 自定义指标
有些指标没有对应的exporter来收集,那么只能通过自定义指标来实现。`node_exporter` 可在启动时指定路径,并将该路径下的 `*.prom` 识别为监控数据文件。
**编写脚本**
```shell
mkdir -p /opt/exports/{scripts,values}
cat > /opt/exports/scripts/pids.sh <<-EOF
#!/bin/bash
echo \# Number of system pids.
echo node_pids_kernel_use_number \$(ps -eLf | wc -l)
echo node_pids_kernel_total_number \$(sysctl kernel.pid_max | awk -F= '{print \$2}')
echo \# Number of user pids.
echo node_pids_user_use_number \$(ps -eLf | egrep "^root" | wc -l)
echo node_pids_user_total_number \$(ulimit -u)
echo \# Number of Cgroups pids.
echo node_pids_cgroup_use_number \$(cat /sys/fs/cgroup/pids/kubepods.slice/pids.current)
echo node_pids_cgroup_total_number \$(cat /sys/fs/cgroup/pids/kubepods.slice/pids.max)
EOF
```
**设置定时任务获取值**
```shell
echo "* * * * * root bash /opt/exports/scripts/pids.sh > /opt/exports/values/pids.prom" >> /etc/crontab
```
**添加参数及挂载文件**
```shell
kubectl -n kube-mon edit ds node-exporter
# 在 secp.template.containers.args 下,新增一行
- --collector.textfile.directory=/opt/exports/values/
# 在 secp.template.containers.volumeMounts 下,新增两行
- name: custom-indicator
mountPath: /opt/exports/values/
# 在 spec.template.volumes 下,新增三行
- name: custom-indicator
hostPath:
path: /opt/exports/values/
```
## 验证
curl -s 192.168.31.103:9100/metrics | grep pids | egrep -v "^#"
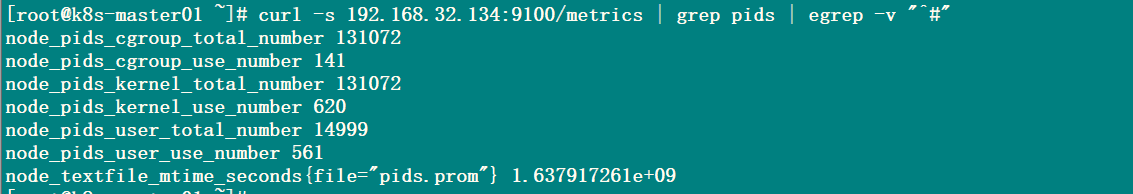
node_pids_cgroup_total_number
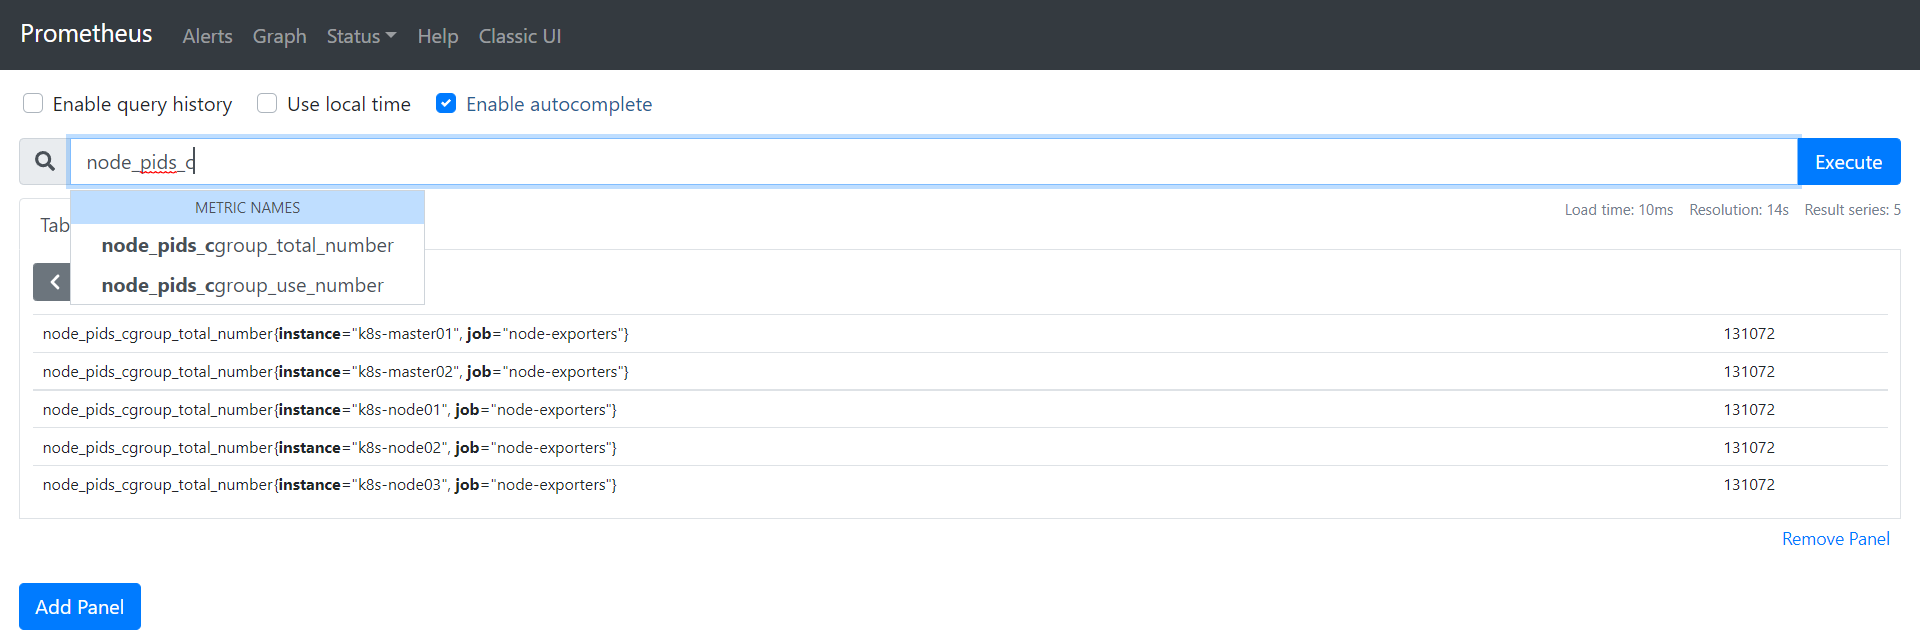
## Prometheus抓取数据
```yaml
- job_name: "node-exporters"
kubernetes_sd_configs:
- role: node
relabel_configs:
- source_labels: [__address__]
action: replace
regex: (.*):10250
target_label: __address__
replacement: $1:9100
metric_relabel_configs:
- source_labels: [__address__]
action: replace
regex: (.*):10250
target_label: instance
replacement: $1
```
## 附加iptables规则
```shell
iptables -t filter -I INPUT -p tcp --dport 9100 -m comment --comment "k8s node exporter ports" -j ACCEPT
```
- 前言
- 架构
- 部署
- kubeadm部署
- kubeadm扩容节点
- 二进制安装基础组件
- 添加master节点
- 添加工作节点
- 选装插件安装
- Kubernetes使用
- k8s与dockerfile启动参数
- hostPort与hostNetwork异同
- 应用上下线最佳实践
- 进入容器命名空间
- 主机与pod之间拷贝
- events排序问题
- k8s会话保持
- 容器root特权
- CNI插件
- calico
- calicoctl安装
- calico网络通信
- calico更改pod地址范围
- 新增节点网卡名不一致
- 修改calico模式
- calico数据存储迁移
- 启用 kubectl 来管理 Calico
- calico卸载
- cilium
- cilium架构
- cilium/hubble安装
- cilium网络路由
- IP地址管理(IPAM)
- Cilium替换KubeProxy
- NodePort运行DSR模式
- IP地址伪装
- ingress使用
- nginx-ingress
- ingress安装
- ingress高可用
- helm方式安装
- 基本使用
- Rewrite配置
- tls安全路由
- ingress发布管理
- 代理k8s集群外的web应用
- ingress自定义日志
- ingress记录真实IP地址
- 自定义参数
- traefik-ingress
- traefik名词概念
- traefik安装
- traefik初次使用
- traefik路由(IngressRoute)
- traefik中间件(middlewares)
- traefik记录真实IP地址
- cert-manager
- 安装教程
- 颁布者CA
- 创建证书
- 外部存储
- 对接NFS
- 对接ceph-rbd
- 对接cephfs
- 监控平台
- Prometheus
- Prometheus安装
- grafana安装
- Prometheus配置文件
- node_exporter安装
- kube-state-metrics安装
- Prometheus黑盒监控
- Prometheus告警
- grafana仪表盘设置
- 常用监控配置文件
- thanos
- Prometheus
- Sidecar组件
- Store Gateway组件
- Querier组件
- Compactor组件
- Prometheus监控项
- grafana
- Querier对接grafana
- alertmanager
- Prometheus对接alertmanager
- 日志中心
- filebeat安装
- kafka安装
- logstash安装
- elasticsearch安装
- elasticsearch索引生命周期管理
- kibana安装
- event事件收集
- 资源预留
- 节点资源预留
- imagefs与nodefs验证
- 资源预留 vs 驱逐 vs OOM
- scheduler调度原理
- Helm
- Helm安装
- Helm基本使用
- 安全
- apiserver审计日志
- RBAC鉴权
- namespace资源限制
- 加密Secret数据
- 服务网格
- 备份恢复
- Velero安装
- 备份与恢复
- 常用维护操作
- container runtime
- 拉取私有仓库镜像配置
- 拉取公网镜像加速配置
- runtime网络代理
- overlay2目录占用过大
- 更改Docker的数据目录
- Harbor
- 重置Harbor密码
- 问题处理
- 关闭或开启Harbor的认证
- 固定harbor的IP地址范围
- ETCD
- ETCD扩缩容
- ETCD常用命令
- ETCD数据空间压缩清理
- ingress
- ingress-nginx header配置
- kubernetes
- 验证yaml合法性
- 切换KubeProxy模式
- 容器解析域名
- 删除节点
- 修改镜像仓库
- 修改node名称
- 升级k8s集群
- 切换容器运行时
- apiserver接口
- 其他
- 升级内核
- k8s组件性能分析
- ETCD
- calico
- calico健康检查失败
- Harbor
- harbor同步失败
- Kubernetes
- 资源Terminating状态
- 启动容器报错