# Seaborn 箱形图
> 原文: [https://pythonbasics.org/seaborn_boxplot/](https://pythonbasics.org/seaborn_boxplot/)
Seaborn 箱形图是一个非常基本的图,箱形图用于可视化分布。
当您要比较两组之间的数据时,这很有用。
有时将箱形图称为箱须图。 任何框均显示数据集的四分位数,而晶须延伸以显示其余分布。
## 箱形图示例
### 箱形图
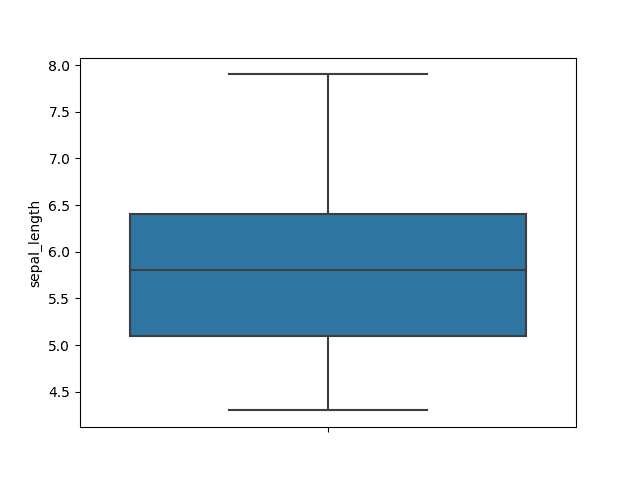
箱形图用`boxplot()`方法处理。 下面的示例加载鸢尾花数据集。 然后,所显示的箱形图显示了最小,最大,第一四分位数和第三四分位数。
```py
import seaborn as sns
import matplotlib.pyplot as plt
df = sns.load_dataset('iris')
df.head()
sns.boxplot( y=df["sepal_length"] );
plt.show()
```
### 水平箱形图
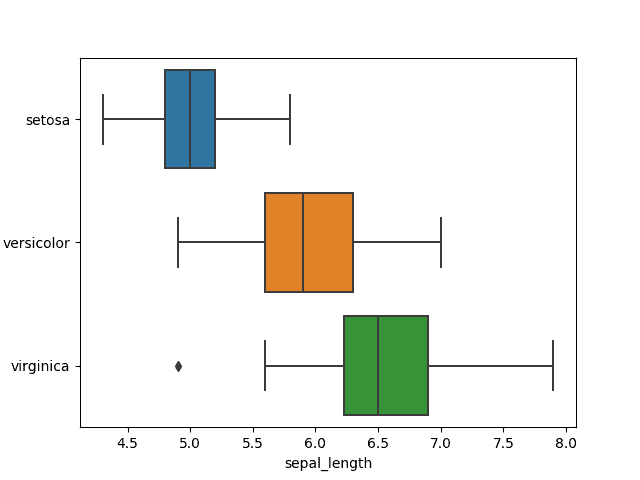
箱形图可以是水平图。 下例显示了水平方向的箱形图。我们再次使用鸢尾花数据集。 显示的颜色是默认颜色,但是它们是可配置的。
```py
import seaborn as sns
import matplotlib.pyplot as plt
df = sns.load_dataset('iris')
df.head()
sns.boxplot( y=df["species"], x=df["sepal_length"] );
plt.show()
```
### 箱形图颜色
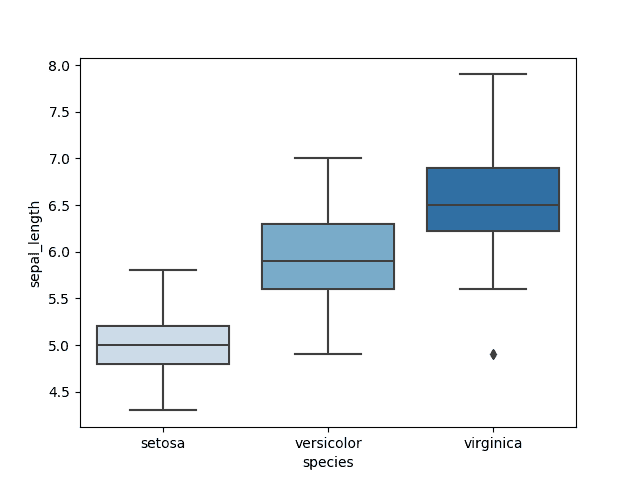
箱形图颜色图颜色是可配置的。 您可以通过传递调色板参数来实现。 有各种各样的调色板,调色板`"Blues"`是各种各样的蓝色。
```py
import seaborn as sns
import matplotlib.pyplot as plt
df = sns.load_dataset('iris')
df.head()
sns.boxplot( x=df["species"], y=df["sepal_length"], palette="Blues");
plt.show()
```
### 多重箱形图
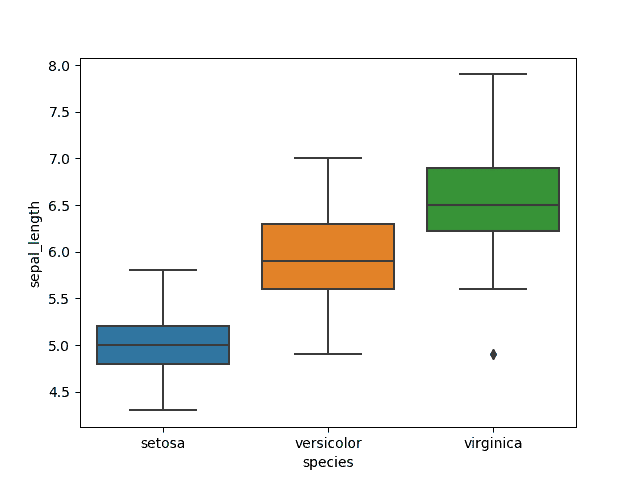
箱形图多重绘图以默认颜色显示法线方向上的集合。
```py
import seaborn as sns
import matplotlib.pyplot as plt
df = sns.load_dataset('iris')
df.head()
sns.boxplot( x=df["species"], y=df["sepal_length"] );
plt.show()
```
### 箱形图的大小
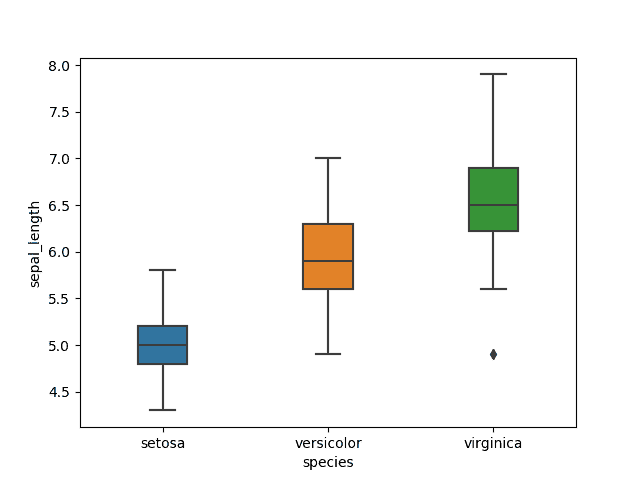
各个箱形图的大小可以通过`width`参数进行更改。 默认宽度为 1,因此任何较小的值都会为框创建较小的宽度。
```py
import seaborn as sns
import matplotlib.pyplot as plt
df = sns.load_dataset('iris')
df.head()
sns.boxplot( x=df["species"], y=df["sepal_length"], width=0.3);
plt.show()
```
- 介绍
- 学习 python 的 7 个理由
- 为什么 Python 很棒
- 学习 Python
- 入门
- 执行 Python 脚本
- 变量
- 字符串
- 字符串替换
- 字符串连接
- 字符串查找
- 分割
- 随机数
- 键盘输入
- 控制结构
- if语句
- for循环
- while循环
- 数据与操作
- 函数
- 列表
- 列表操作
- 排序列表
- range函数
- 字典
- 读取文件
- 写入文件
- 嵌套循环
- 切片
- 多个返回值
- 作用域
- 时间和日期
- try except
- 如何使用pip和 pypi
- 面向对象
- 类
- 构造函数
- 获取器和设置器
- 模块
- 继承
- 静态方法
- 可迭代对象
- Python 类方法
- 多重继承
- 高级
- 虚拟环境
- 枚举
- Pickle
- 正则表达式
- JSON 和 python
- python 读取 json 文件
- 装饰器
- 网络服务器
- 音频
- 用 Python 播放声音
- python 文字转语音
- 将 MP3 转换为 WAV
- 转录音频
- Tkinter
- Tkinter
- Tkinter 按钮
- Tkinter 菜单
- Tkinter 标签
- Tkinter 图片
- Tkinter 画布
- Tkinter 复选框
- Tkinter 输入框
- Tkinter 文件对话框
- Tkinter 框架
- Tkinter 列表框
- Tkinter 消息框
- Tkinter 单选按钮
- Tkinter 刻度
- 绘图
- Matplotlib 条形图
- Matplotlib 折线图
- Seaborn 分布图
- Seaborn 绘图
- Seaborn 箱形图
- Seaborn 热力图
- Seaborn 直线图
- Seaborn 成对图
- Seaborn 调色板
- Seaborn Pandas
- Seaborn 散点图
- Plotly
- PyQt
- PyQt
- 安装 PyQt
- PyQt Hello World
- PyQt 按钮
- PyQt QMessageBox
- PyQt 网格
- QLineEdit
- PyQT QPixmap
- PyQt 组合框
- QCheckBox
- QSlider
- 进度条
- PyQt 表格
- QVBoxLayout
- PyQt 样式
- 编译 PyQt 到 EXE
- QDial
- QCheckBox
- PyQt 单选按钮
- PyQt 分组框
- PyQt 工具提示
- PyQt 工具箱
- PyQt 工具栏
- PyQt 菜单栏
- PyQt 标签小部件
- PyQt 自动补全
- PyQt 列表框
- PyQt 输入对话框
- Qt Designer Python
- 机器学习
- 数据科学
- 如何从机器学习和 AI 认真地起步
- 为什么要使用 Python 进行机器学习?
- 机器学习库
- 什么是机器学习?
- 区分机器学习,深度学习和 AI?
- 机器学习
- 机器学习算法比较
- 为什么要使用 Scikit-Learn?
- 如何在 Python 中加载机器学习数据
- 机器学习分类器
- 机器学习回归
- Python 中的多项式回归
- 决策树
- k 最近邻
- 训练测试拆分
- 人脸检测
- 如何为 scikit-learn 机器学习准备数据
- Selenium
- Selenium 浏览器
- Selenium Cookie
- Selenium 执行 JavaScript
- Selenium 按 ID 查找元素
- Selenium 无头 Firefox
- Selenium Firefox
- Selenium 获取 HTML
- Selenium 键盘
- Selenium 最大化
- Selenium 截图
- Selenium 向下滚动
- Selenium 切换到窗口
- Selenium 等待页面加载
- Flask 教程
- Flask 教程:Hello World
- Flask 教程:模板
- Flask 教程:路由
