一 添加极坐标图形
```
{
name: "",
type: "roseLine",
coverImage: contextPath + "/images/componenttypes/" + locale + "/echarts/zh\_pictogram.png",
coverImageWidth: a,
data: true,
dimensions: 1,
measures: 1,
tip: "极坐标"
}
```
二 添加option对象 搜索pictorialColumnOptionTemplate 在下面添加
```
// 玫瑰图 start
var roseLineOptionTemplate = {
color: colorValueSeries,
title: {
show:false
},
tooltip: {
show: true,
trigger: "item",
formatter: "{b} : {c}",
axisPointer: {
type: "shadow"
}
},
angleAxis: {
type: 'category',
data: ["北", "北东北", "东北", "东东北", "东", "东东南", "东南", "南东南", "南", "南西南", "西南", "西西南", "西", "西西北", "西北", "北西北"],
boundaryGap: false,
axisTick: {
show:false,
alignWithLabel: false
},
axisLine: {
show:false,
lineStyle: {
color: '#ff8800'
}
},
axisLabel: {
show: false,
color: '#ff8800',
fontSize: 16
},
splitLine: {
show: false,
lineStyle: {
color: "#ff8800",
width: 1,
type: "solid"
}
}
},
radiusAxis: {
axisTick: {
show:false
},
axisLine: {
show: false,
lineStyle: {
color: "#0B3E5E",
width: 1,
type: "solid"
},
},
axisLabel: {
formatter: '{value} %',
show: false,
padding: [0, 0, 20, 0],
color: "#ff8800",
fontSize: 16
},
splitLine: {
show:false,
lineStyle: {
color: "#ff8800",
width: 2,
type: "dashed"
}
},
z: 10
},
polar: {},
legend: {
show: true,
right: 0,
bottom: 0,
type: 'scroll',
orient: 'vertical',
data: ['<0.5m/s', '0.5-2m/s', '2-4m/s', '4-6m/s', '6-8m/s', '8-10m/s', '>10m/s']
},
series: [{
type: 'bar',
data: [6.16, 6.84, 8.49, 8.11, 8.78, 7.13, 5.7, 4.28, 3.79, 4.07, 4.46, 5.76, 7.26, 6.92, 6.92, 5.32],
coordinateSystem: 'polar',
name: '0.5m/s',
stack: 'a'
}, {
type: 'bar',
data: [5.82, 8.0, 12.36, 11.77, 9.38, 6.19, 4.61, 3.87, 3.44, 3.17, 2.45, 3.58, 6.91, 6.47, 6.47, 5.5],
coordinateSystem: 'polar',
name: '0.5-2m/s',
stack: 'a'
}, {
type: 'bar',
data: [3.4, 7.37, 16.29, 12.56, 7.37, 5.04, 1.84, 1.11, 1.89, 2.97, 1.82, 4.11, 10.41, 10.01, 10.01, 3.81],
coordinateSystem: 'polar',
name: '2-4m/s',
stack: 'a'
}, {
type: 'bar',
data: [3.01, 6.22, 14.46, 10.34, 4.45, 4.52, 0.98, 0.59, 0.39, 2.23, 1.37, 4.25, 15.77, 13.94, 13.94, 3.53],
coordinateSystem: 'polar',
name: '4-6m/s',
stack: 'a'
}, {
type: 'bar',
data: [10.28, 14.65, 9.25, 12.34, 1.03, 1.54, 0.26, 0.26, 0.51, 1.03, 1.8, 7.2, 12.34, 11.57, 11.57, 4.37],
coordinateSystem: 'polar',
name: '6-8m/s',
stack: 'a'
}, {
type: 'bar',
data: [6.16, 6.84, 8.49, 8.11, 8.78, 7.13, 5.7, 4.28, 3.79, 4.07, 4.46, 5.76, 7.26, 6.92, 6.92, 5.32],
coordinateSystem: 'polar',
name: '8-10m/s',
stack: 'a'
}, {
type: 'bar',
data: [6.16, 6.84, 8.49, 8.11, 8.78, 7.13, 5.7, 4.28, 3.79, 4.07, 4.46, 5.76, 7.26, 6.92, 6.92, 5.32],
coordinateSystem: 'polar',
name: '>10m/s',
stack: 'a'
}]
};
// 玫瑰图 end
```
复制对象 搜索 angular.copy(pictorialColumnOptionTemplate) 如图位置
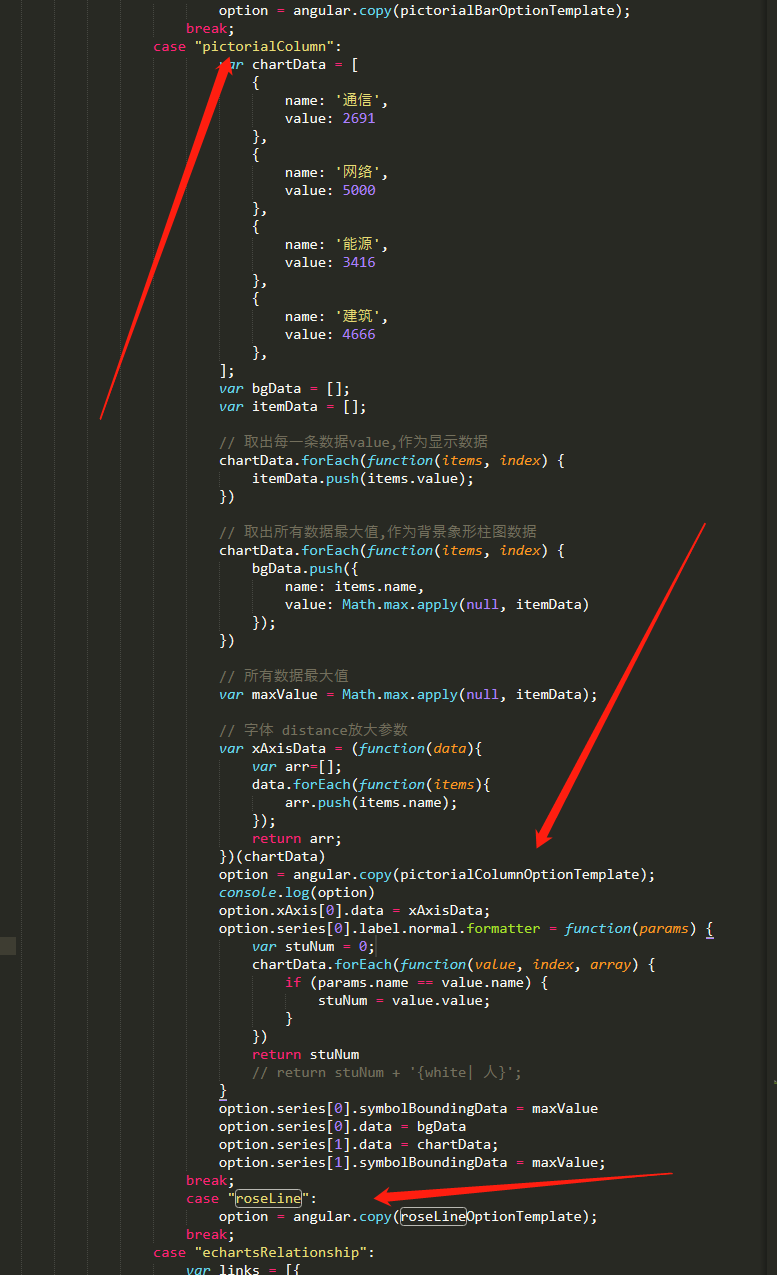
```
case "roseLine":
option = angular.copy(roseLineOptionTemplate);
break;
```
三 搜索 getThresholdCategoryName 和isShowEventCategory 分别添加
如图
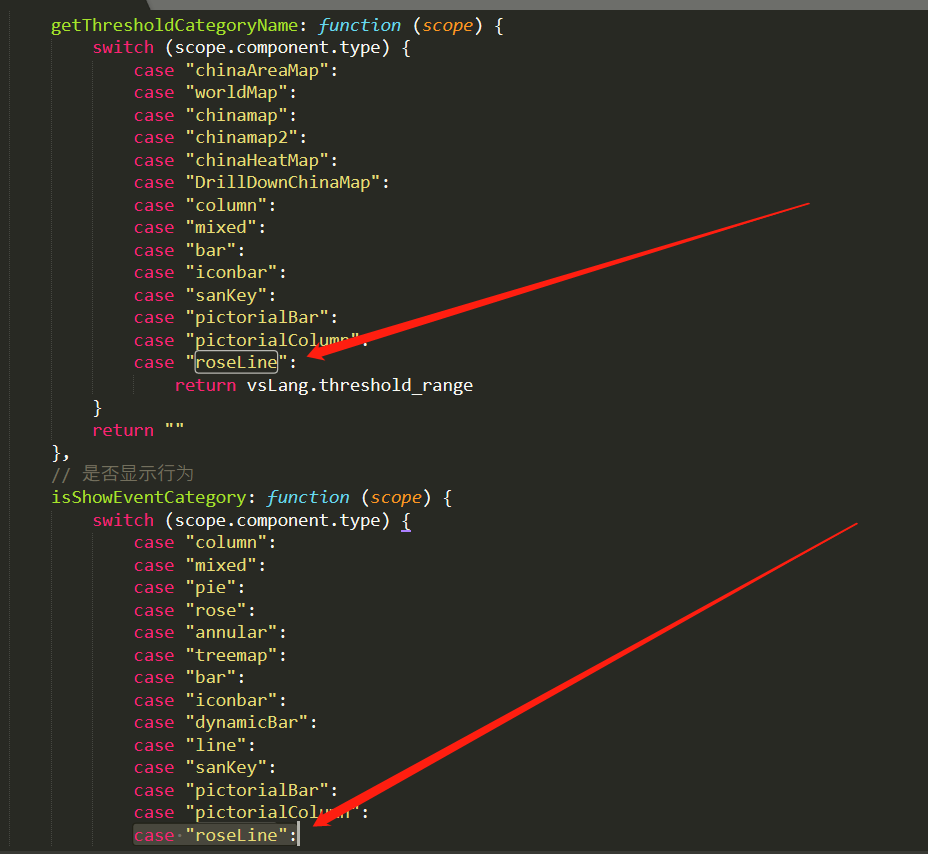
```
case "roseLine":
```
四 弹窗单位配置 搜case "pictorialColumn": 在这个配置下面写 代码块基本上差不多 稍有改动
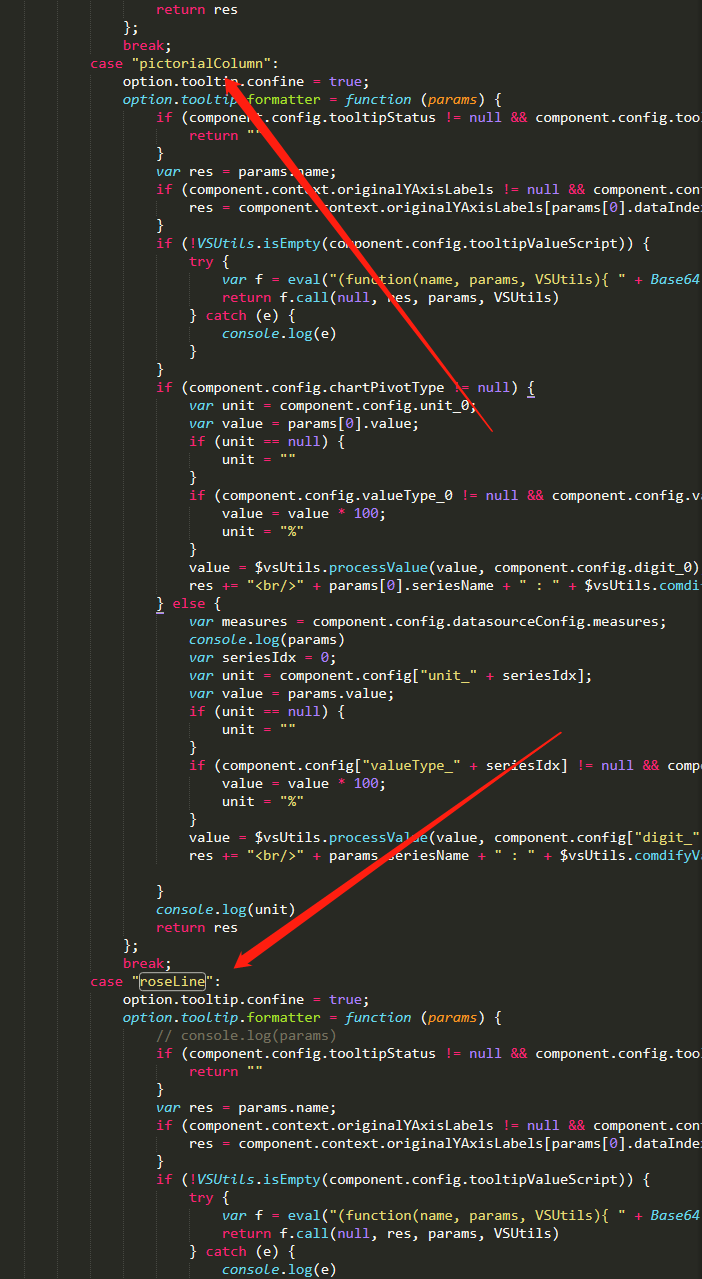
```
case "roseLine":
option.tooltip.confine = true;
option.tooltip.formatter = function (params) {
// console.log(params)
if (component.config.tooltipStatus != null && component.config.tooltipStatus === "hide") {
return ""
}
var res = params.name;
if (component.context.originalYAxisLabels != null && component.context.originalYAxisLabels.length > params[0].dataIndex) {
res = component.context.originalYAxisLabels[params[0].dataIndex]
}
if (!VSUtils.isEmpty(component.config.tooltipValueScript)) {
try {
var f = eval("(function(name, params, VSUtils){ " + Base64.decode(component.config.tooltipValueScript) + "})");
return f.call(null, res, params, VSUtils)
} catch (e) {
console.log(e)
}
}
if (component.config.chartPivotType != null) {
var unit = component.config.unit_0;
var value = params[0].value;
if (unit == null) {
unit = ""
}
if (component.config.valueType_0 != null && component.config.valueType_0 === "percent") {
value = value * 100;
unit = "%"
}
value = $vsUtils.processValue(value, component.config.digit_0);
res += "<br/>" + params[0].seriesName + " : " + $vsUtils.comdifyValue(value) + unit
} else {
var measures = component.config.datasourceConfig.measures;
// console.log(params)
var seriesIdx = 0;
var unit = component.config["unit_" + params.dataIndex];
// console.log(component.config)
var value = params.value;
if (unit == null) {
unit = ""
}
if (component.config["valueType_" + params.dataIndex] != null && component.config["valueType_" +params.dataIndex] === "percent") {
value = value * 100;
unit = "%"
}
value = $vsUtils.processValue(value, component.config["digit_" + params.dataIndex]);
res += "<br/>" + params.seriesName + " : " + $vsUtils.comdifyValue(value) + unit
}
return res
};
break;
```
五:搜索 internalRefreshPictorialColumnChartModelData 在这个下面 写数据处理 如下代码
```
var internalRefreshroseLineChartModelData = function(){
var option = component.config.chartConfig;
var dimensions = component.config.datasourceConfig.dimensions;
var measures = component.config.datasourceConfig.measures;
var data = component.context.data;
// option.chartData = data;
if (data == null) {
return
}
var measureIdx = 0;
if (component.config.receiveMeasureLink != null && component.config.receiveMeasureLink === true) {
var newMeasures = scope.getSelectedLinkMeasure(component, component.config.datasourceConfig.measures);
for (var i = 0; i < measures.length; i++) {
if (newMeasures[i] != null) {
measureIdx = i;
break
}
}
}
var legendData = [];
var newSeries = [];
var seriesMap = {};
for (var i = 0; i < data.length; i++) {
for (var m = 0; m < measures.length; m++) {
var show = component.config["show_" + m];
if (show != null && show === false) {
continue
}
var seriesName = data[i][dimensions[dimensions.length - 1].name];
if (legendData.indexOf(seriesName) < 0) {
legendData.push(seriesName)
}
var series = seriesMap[seriesName];
if (series == null) {
series = {
name: seriesName,
type: 'bar',
coordinateSystem: 'polar',
stack: 'a',
data: []
};
newSeries.push(series);
seriesMap[seriesName] = series;
series.data = [];
}
series.data.push(data[i][measures[m].name])
var legendValue = measures[m].label;
if (component.config["measureAlias_" + m] != null && component.config["measureAlias_" + m].length > 0) {
option.angleAxis.data[m] = component.config["measureAlias_" + m];
legendValue = component.config["measureAlias_" + m]
}
legendData.push(legendValue);
if (option.angleAxis.data[m] == null || option.angleAxis.data.length == 0) {
option.angleAxis.data[m] = measures[m].label
}
option.series[m].seriesIndex = measureIdx;
}
}
// console.log(newSeries)
// console.log(legendData)
// option.series = newSeries;
// option.series[0].seriesIndex = measureIdx;
// console.log(option)
setTimeout(function () {
component.context.chart.setOption(option, true)
})
}
```
六 写调用 数据处理的方法
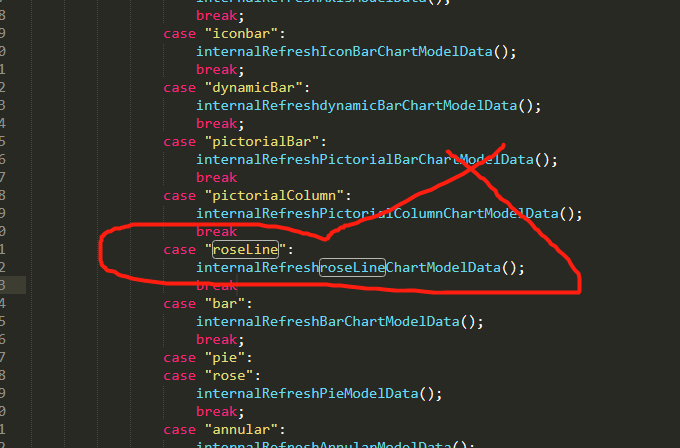
```
case "roseLine":
internalRefreshroseLineChartModelData();
break
```
七:写 联动 弹框显示隐藏 搜索case "pictorialColumn":
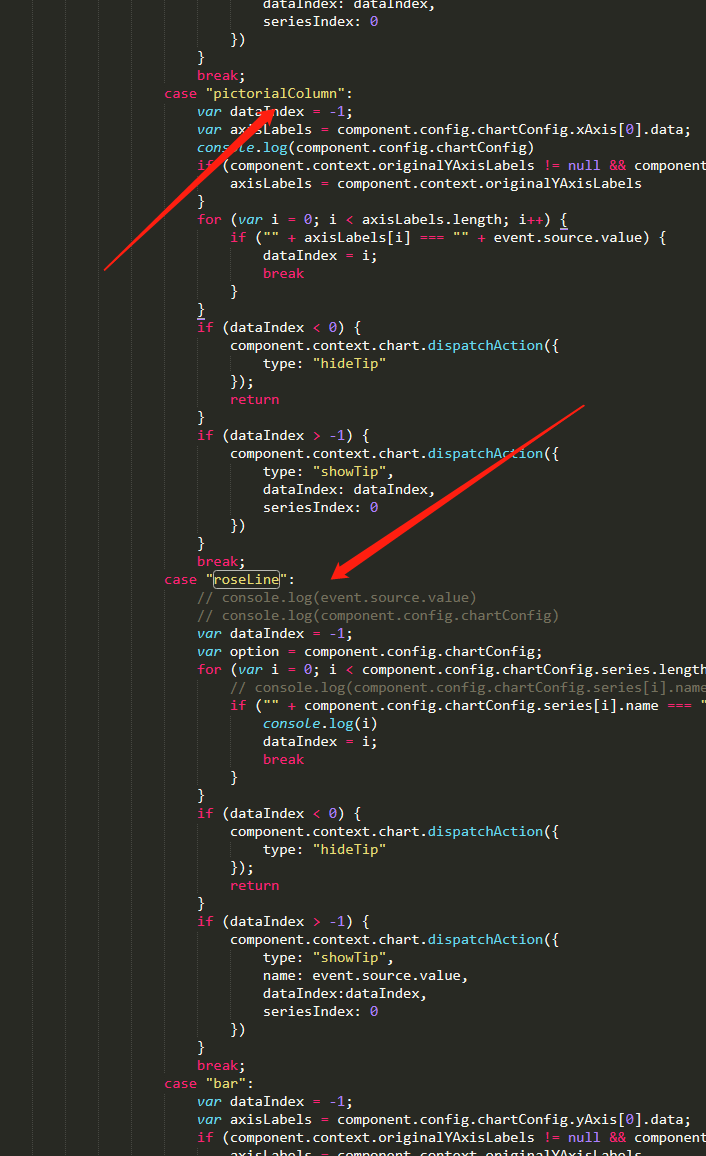
```
case "roseLine":
// console.log(event.source.value)
// console.log(component.config.chartConfig)
var dataIndex = -1;
var option = component.config.chartConfig;
for (var i = 0; i < component.config.chartConfig.series.length; i++) {
// console.log(component.config.chartConfig.series[i].name)
if ("" + component.config.chartConfig.series[i].name === "" + event.source.value) {
console.log(i)
dataIndex = i;
break
}
}
if (dataIndex < 0) {
component.context.chart.dispatchAction({
type: "hideTip"
});
return
}
if (dataIndex > -1) {
component.context.chart.dispatchAction({
type: "showTip",
name: event.source.value,
dataIndex:dataIndex,
seriesIndex: 0
})
}
break;
```
八搜索 case "pictorialColumn": 写如下代码
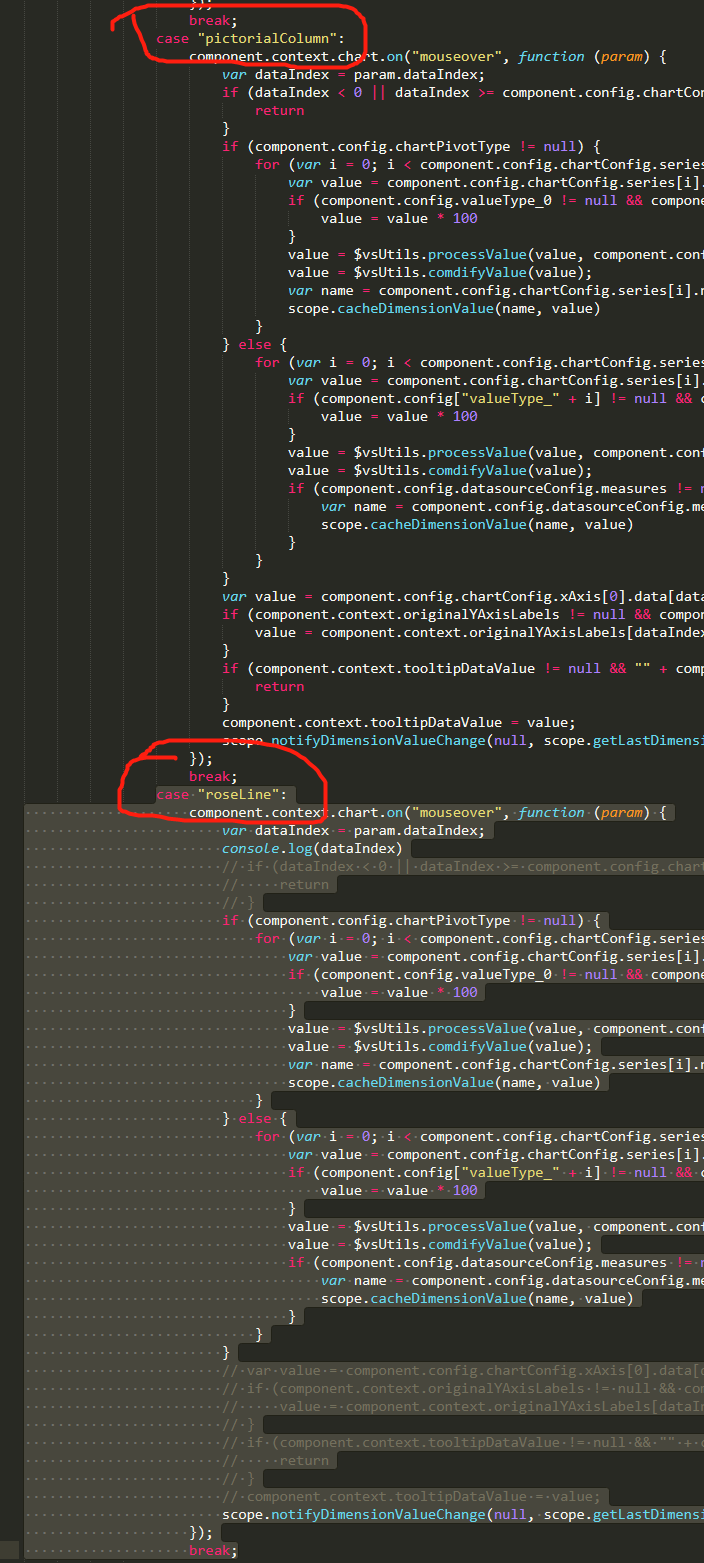
```
case "roseLine":
component.context.chart.on("mouseover", function (param) {
var dataIndex = param.dataIndex;
console.log(dataIndex)
// if (dataIndex < 0 || dataIndex >= component.config.chartConfig.xAxis[0].data.length) {
// return
// }
if (component.config.chartPivotType != null) {
for (var i = 0; i < component.config.chartConfig.series.length; i++) {
var value = component.config.chartConfig.series[i].data[dataIndex];
if (component.config.valueType_0 != null && component.config.valueType_0 === "percent") {
value = value * 100
}
value = $vsUtils.processValue(value, component.config.digit_0);
value = $vsUtils.comdifyValue(value);
var name = component.config.chartConfig.series[i].name;
scope.cacheDimensionValue(name, value)
}
} else {
for (var i = 0; i < component.config.chartConfig.series.length; i++) {
var value = component.config.chartConfig.series[i].data[dataIndex];
if (component.config["valueType_" + i] != null && component.config["valueType_" + i] === "percent") {
value = value * 100
}
value = $vsUtils.processValue(value, component.config["digit_" + i]);
value = $vsUtils.comdifyValue(value);
if (component.config.datasourceConfig.measures != null) {
var name = component.config.datasourceConfig.measures[0].label;
scope.cacheDimensionValue(name, value)
}
}
}
// var value = component.config.chartConfig.xAxis[0].data[dataIndex];
// if (component.context.originalYAxisLabels != null && component.context.originalYAxisLabels.length > dataIndex) {
// value = component.context.originalYAxisLabels[dataIndex]
// }
// if (component.context.tooltipDataValue != null && "" + component.context.tooltipDataValue === "" + value) {
// return
// }
// component.context.tooltipDataValue = value;
scope.notifyDimensionValueChange(null, scope.getLastDimension(), value)
});
break;
```
九 配置色块 搜索 var extensionCategory = null;
如图位置 添加代码
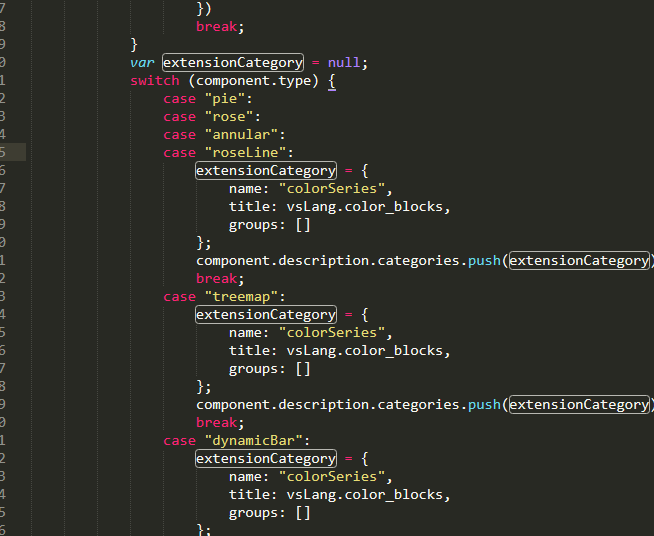
```
case "roseLine":
```
十 图例配置项
如图位置
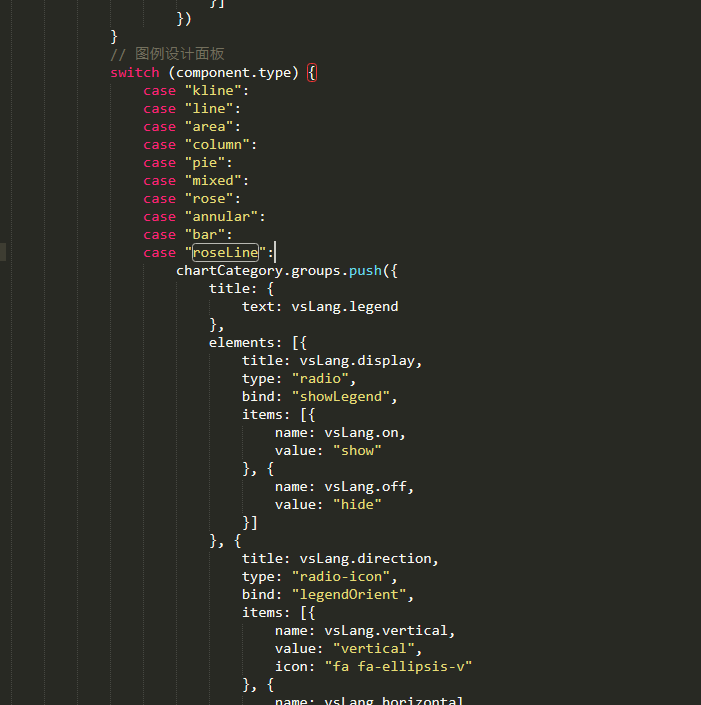
```
case "roseLine":
```
十一 搜索 component.config.pictorialColumnlabelFontSize 在下面添加 配置项
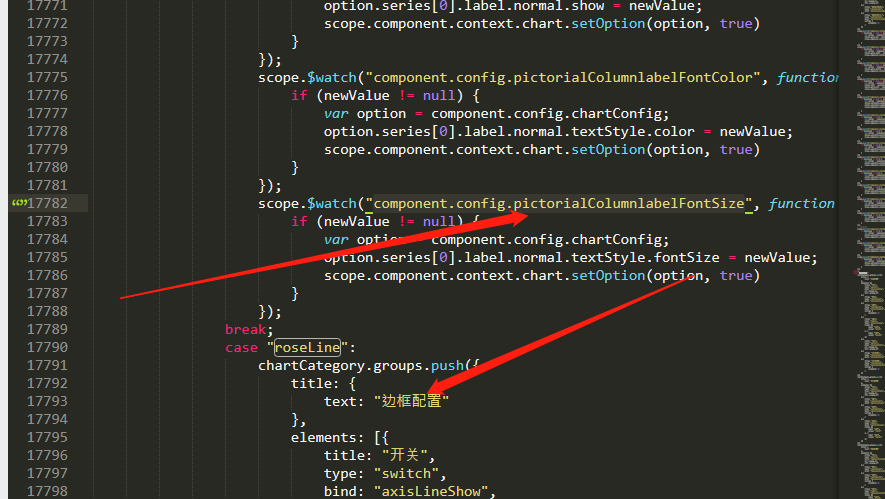
```
case "roseLine":
chartCategory.groups.push({
title: {
text: "边框配置"
},
elements: [{
title: "开关",
type: "switch",
bind: "axisLineShow",
on: vsLang.on,
off: vsLang.off
},{
title: "颜色",
type: "colorpicker",
bind: "axisLineColor"
},{
title: "线宽",
type: "configSlide",
bind: "axisLineWidth",
config: {
slideEnd: 50
}
},{
title: "线性",
type: "radio",
bind: "axisLineType",
items: [{
name: "实线",
value: "solid"
}, {
name: "虚线",
value: "dashed"
}]
},{
title: "文字",
type: "switch",
bind: "axisLabelShow",
on: vsLang.on,
off: vsLang.off
},{
title: "文字颜色",
type: "colorpicker",
bind: "axisLabelColor"
},{
title: "文字线宽",
type: "configSlide",
bind: "axisLabelFontsize",
config: {
slideEnd: 50
}
}]
});
chartCategory.groups.push({
title: {
text: "纵线配置"
},
elements: [{
title: "开关",
type: "switch",
bind: "splitLineShow",
on: vsLang.on,
off: vsLang.off
},{
title: "颜色",
type: "colorpicker",
bind: "splitLineColor"
},{
title: "线宽",
type: "configSlide",
bind: "splitLineWidth",
config: {
slideEnd: 50
}
},{
title: "线性",
type: "radio",
bind: "splitLineType",
items: [{
name: "实线",
value: "solid"
}, {
name: "虚线",
value: "dashed"
}]
}]
});
chartCategory.groups.push({
title: {
text: "轴线配置"
},
elements: [{
title: "开关",
type: "switch",
bind: "radiusAxisLineShow",
on: vsLang.on,
off: vsLang.off
},{
title: "颜色",
type: "colorpicker",
bind: "radiusAxisLineColor"
},{
title: "线宽",
type: "configSlide",
bind: "radiusAxisLineWidth",
config: {
slideEnd: 50
}
},{
title: "线性",
type: "radio",
bind: "radiusAxisLineType",
items: [{
name: "实线",
value: "solid"
}, {
name: "虚线",
value: "dashed"
}]
},{
title: "文字",
type: "switch",
bind: "radiusAxisLabelShow",
on: vsLang.on,
off: vsLang.off
},{
title: "文字颜色",
type: "colorpicker",
bind: "radiusAxisLabelColor"
},{
title: "文字大小",
type: "configSlide",
bind: "radiusAxisLabelFontSize",
config: {
slideEnd: 50
}
},{
title: "文字单位",
type: "radio",
bind: "radiusAxisLabelFormatter",
items: [{
name: "无",
value: ""
}, {
name: "百分比",
value: "%"
}]
}]
});
chartCategory.groups.push({
title: {
text: "内线配置"
},
elements: [{
title: "开关",
type: "switch",
bind: "radiussplitLineShow",
on: vsLang.on,
off: vsLang.off
},{
title: "颜色",
type: "colorpicker",
bind: "radiussplitLineColor"
},{
title: "线宽",
type: "configSlide",
bind: "radiussplitLineWidth",
config: {
slideEnd: 50
}
},{
title: "线性",
type: "radio",
bind: "radiussplitLineType",
items: [{
name: "实线",
value: "solid"
}, {
name: "虚线",
value: "dashed"
}]
}]
});
scope.$watch("component.config.axisLineShow", function (newValue) {
if (newValue != null) {
var option = component.config.chartConfig;
option.angleAxis.axisLine.show = newValue;
scope.component.context.chart.setOption(option, true)
}
});
scope.$watch("component.config.axisLineColor", function (newValue) {
if (newValue != null) {
var option = component.config.chartConfig;
option.angleAxis.axisLine.lineStyle.color = newValue;
scope.component.context.chart.setOption(option, true)
}
});
scope.$watch("component.config.axisLineWidth", function (newValue) {
if (newValue != null) {
var option = component.config.chartConfig;
option.angleAxis.axisLine.lineStyle.width = newValue;
scope.component.context.chart.setOption(option, true)
}
});
scope.$watch("component.config.axisLineType", function(newValue, oldValue) {
if (newValue != null && (oldValue == null || oldValue !== newValue)) {
var option = component.config.chartConfig;
option.angleAxis.axisLine.lineStyle.type = newValue;
scope.component.context.chart.setOption(option, true)
}
});
// end
scope.$watch("component.config.axisLabelShow", function(newValue, oldValue) {
if (newValue != null && (oldValue == null || oldValue !== newValue)) {
var option = component.config.chartConfig;
option.angleAxis.axisLabel.show = newValue;
scope.component.context.chart.setOption(option, true)
}
});
scope.$watch("component.config.axisLabelColor", function (newValue) {
if (newValue != null) {
var option = component.config.chartConfig;
option.angleAxis.axisLabel.color = newValue;
scope.component.context.chart.setOption(option, true)
}
});
scope.$watch("component.config.axisLabelFontsize", function (newValue) {
if (newValue != null) {
var option = component.config.chartConfig;
option.angleAxis.axisLabel.fontSize = newValue;
scope.component.context.chart.setOption(option, true)
}
});
// end
scope.$watch("component.config.splitLineShow", function(newValue, oldValue) {
if (newValue != null && (oldValue == null || oldValue !== newValue)) {
var option = component.config.chartConfig;
option.angleAxis.splitLine.show = newValue;
scope.component.context.chart.setOption(option, true)
}
});
scope.$watch("component.config.splitLineColor", function (newValue) {
if (newValue != null) {
var option = component.config.chartConfig;
option.angleAxis.splitLine.lineStyle.color = newValue;
scope.component.context.chart.setOption(option, true)
}
});
scope.$watch("component.config.splitLineWidth", function (newValue) {
if (newValue != null) {
var option = component.config.chartConfig;
option.angleAxis.splitLine.lineStyle.width = newValue;
scope.component.context.chart.setOption(option, true)
}
});
scope.$watch("component.config.splitLineType", function(newValue, oldValue) {
if (newValue != null && (oldValue == null || oldValue !== newValue)) {
var option = component.config.chartConfig;
option.angleAxis.splitLine.lineStyle.type = newValue;
scope.component.context.chart.setOption(option, true)
}
});
// end
scope.$watch("component.config.radiusAxisLineShow", function(newValue, oldValue) {
if (newValue != null && (oldValue == null || oldValue !== newValue)) {
var option = component.config.chartConfig;
option.radiusAxis.axisLine.show = newValue;
scope.component.context.chart.setOption(option, true)
}
});
scope.$watch("component.config.radiusAxisLineColor", function (newValue) {
if (newValue != null) {
var option = component.config.chartConfig;
option.radiusAxis.axisLine.lineStyle.color = newValue;
scope.component.context.chart.setOption(option, true)
}
});
scope.$watch("component.config.radiusAxisLineWidth", function (newValue) {
if (newValue != null) {
var option = component.config.chartConfig;
option.radiusAxis.axisLine.lineStyle.width = newValue;
scope.component.context.chart.setOption(option, true)
}
});
scope.$watch("component.config.radiusAxisLineType", function(newValue, oldValue) {
if (newValue != null && (oldValue == null || oldValue !== newValue)) {
var option = component.config.chartConfig;
option.radiusAxis.axisLine.lineStyle.type = newValue;
scope.component.context.chart.setOption(option, true)
}
});
// end
scope.$watch("component.config.radiusAxisLabelShow", function(newValue, oldValue) {
if (newValue != null && (oldValue == null || oldValue !== newValue)) {
var option = component.config.chartConfig;
option.radiusAxis.axisLabel.show = newValue;
scope.component.context.chart.setOption(option, true)
}
});
scope.$watch("component.config.radiusAxisLabelColor", function (newValue) {
if (newValue != null) {
var option = component.config.chartConfig;
option.radiusAxis.axisLabel.color = newValue;
scope.component.context.chart.setOption(option, true)
}
});
scope.$watch("component.config.radiusAxisLabelFontSize", function (newValue) {
if (newValue != null) {
var option = component.config.chartConfig;
option.radiusAxis.axisLabel.fontSize = newValue;
scope.component.context.chart.setOption(option, true)
}
});
scope.$watch("component.config.radiusAxisLabelFormatter", function(newValue, oldValue) {
if (newValue != null && (oldValue == null || oldValue !== newValue)) {
var option = component.config.chartConfig;
option.radiusAxis.axisLabel.formatter = '{value} '+newValue;
scope.component.context.chart.setOption(option, true)
}
});
// end
scope.$watch("component.config.radiussplitLineShow", function(newValue, oldValue) {
if (newValue != null && (oldValue == null || oldValue !== newValue)) {
var option = component.config.chartConfig;
option.radiusAxis.splitLine.show = newValue;
scope.component.context.chart.setOption(option, true)
}
});
scope.$watch("component.config.radiussplitLineColor", function (newValue) {
if (newValue != null) {
var option = component.config.chartConfig;
option.radiusAxis.splitLine.lineStyle.color = newValue;
scope.component.context.chart.setOption(option, true)
}
});
scope.$watch("component.config.radiussplitLineWidth", function (newValue) {
if (newValue != null) {
var option = component.config.chartConfig;
option.radiusAxis.splitLine.lineStyle.width = newValue;
scope.component.context.chart.setOption(option, true)
}
});
scope.$watch("component.config.radiussplitLineType", function(newValue, oldValue) {
if (newValue != null && (oldValue == null || oldValue !== newValue)) {
var option = component.config.chartConfig;
option.radiusAxis.splitLine.lineStyle.type = newValue;
scope.component.context.chart.setOption(option, true)
}
});
break;
```
十三 添加 提示框配置
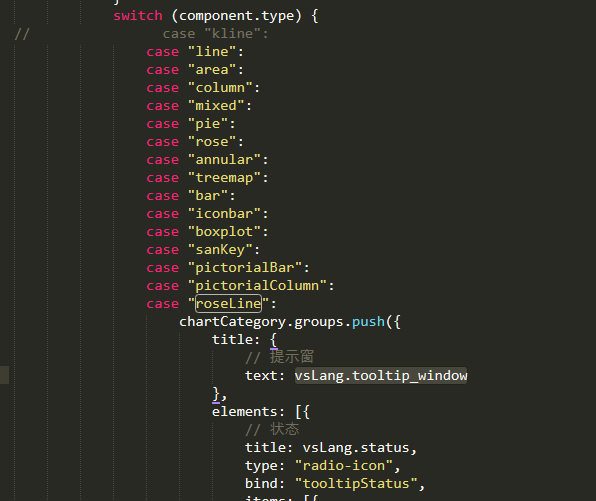
```
case "roseLine":
```
搜索 component.config.chartConfig.tooltip.textStyle 在上面添加
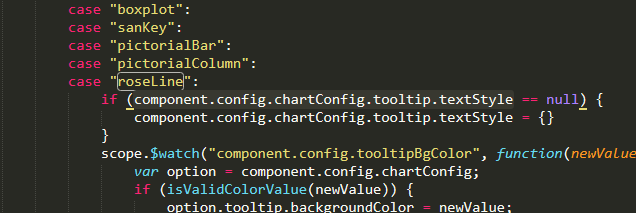
```
case "roseLine":
```
搜索 component.config.legendItemHeight 在上面添加
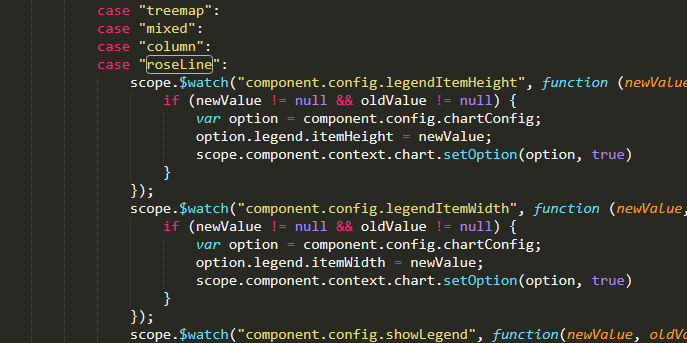
```
case "roseLine":
```
搜索 vsLang.color_series 在上面 添加
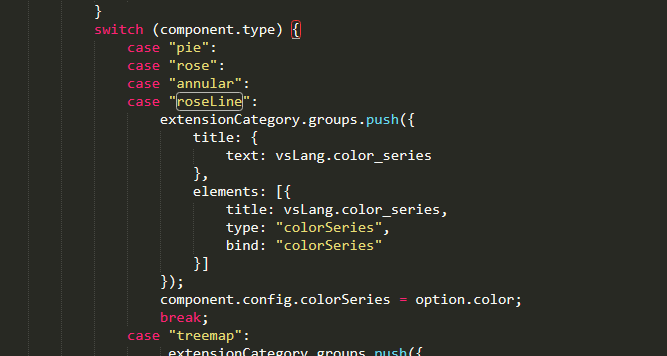
```
case "roseLine":
```
搜索 case "sanKey": 在如图的位置添加下面代码
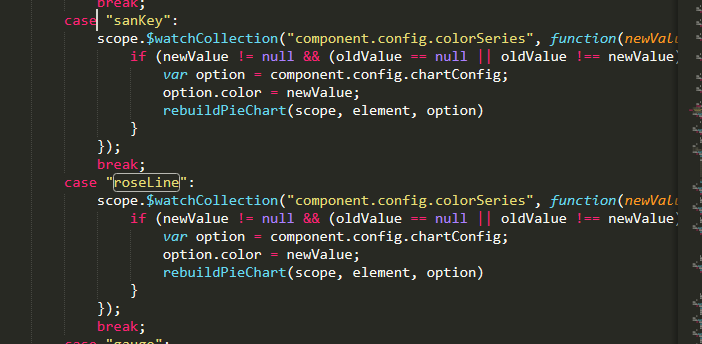
```
case "roseLine":
scope.$watchCollection("component.config.colorSeries", function(newValue, oldValue) {
if (newValue != null && (oldValue == null || oldValue !== newValue)) {
var option = component.config.chartConfig;
option.color = newValue;
rebuildPieChart(scope, element, option)
}
});
break;
```
- video
- treemap
- mian.html文件注释
- 配置项tab
- 配置项属性
- internalRefreshAxisMdelData函数梳理
- 函数配置项-engine文件
- 替换数据源流程
- design.js
- 树图
- 下钻 废弃
- 人体图
- 下钻地图
- 行列互转
- 预览样式
- logo旁边的报表名
- echarts 组件生成图片
- 数据集样式
- 头部 黑色head
- 手机 ipad 图片
- k线图部分
- 平台管理css样式
- 目录css和平板的边距
- 设计页-数据源-目录
- 数据集 - 查看数据表 -按钮和目录样式
- 报表列表页按钮css
- 角色管理页按钮css
- 推送通知按钮css
- 子账号按钮css
- 数据连接
- openlayers地图线路图
- openlayers4_map_designer.js
- openlayers4_map_view.js
- 说明
- 常用图标小bug
- echarts 气泡地图
- echarts 线路轨迹图
- 导出pdf
- 可视化sql--css
- 表格滚动
- 主题色
- 时间轴
- 分享弹框
- 管理平台header和菜单
- 报表平台和菜单
- 初始化组件颜色
- 其他弹框
- olap分析样式-废弃
- 3d地图柱状图
- 关系图
- olap分析
- 地区地图
- k线图相关属性设置
- 世界地图
- 时间轴(new)
- 选择省份下转地图
- 选择省市飞线地图
- 面积预警地图默认颜色
- 组件覆层开关组件
- 汽车仪表盘bug
- 雷达图bug修复不能分享的问题
- 饼状 条形图 自动播放
- 临时用
- 自动轮播
- 方形元素 按钮浮动报错
- 面积预警地图整合可选择省市区
- 下钻地图添加返回按钮
- 下钻地图修复预警bug
- 基本时间组件
- 添加时钟组件
- 3d地球组件
- 盒须图
- 组件加载动画
- 报表背景渐变色
- 主题模板
- 没用
- 3机房第三方组件
- 设计
- 分享
- 3d机房需要的静态资源
- cesium地球需要的文件以及样式
- cesium地球
- 设计页
- 分享页
- 图标条形图
- 世豪-前端代码整理
- component.css 文件新添加
- 杂项
- index.jsp
- designer.css 样式暂时不整理 里面比较杂
- vs-common.js 新加生成html2canvas pdf
- vs-component-basic.js 完
- vs-component-datasource.js 完
- vs-component-engine.js 完
- vs-component-widget-grid.js 完
- vs-component-widget-square.js 完
- vs-designer.js 完
- vs-designer-component.js 完
- vs-designer-report.js 完
- vs-designer-reportpage.js 完
- vs-component-echarts.js 完
- main.html 完
- component.html 新加组件设置页模板
- 以前的报表页设置控制器---做个记录
- 大概修改过的代码
- 2019-5-8 修改皮肤控制器
- 选择模板
- 桑基图2019-11-20
- bug 修正 2019-11-21
- 插图柱状图
- cesiumchart组件
- gis 地图 联动 弹框 图标
- 动态面积图添加按钮类配置项
- 玫瑰图形组件
- cesium 图形 和three.js 冲突的bug
- gis 地图 默认图层
- 网格标签
- gis 点图 值域
- gis 面图 值域
- 按钮图标添加提示框
- 百度地图
- 剩余的组件
- gulp说明文档
- 色斑图加透明
