# seaborn.catplot
> 译者:[LIJIANcoder97](https://github.com/LIJIANcoder97)
```py
seaborn.catplot(x=None, y=None, hue=None, data=None, row=None, col=None, col_wrap=None, estimator=<function mean>, ci=95, n_boot=1000, units=None, order=None, hue_order=None, row_order=None, col_order=None, kind='strip', height=5, aspect=1, orient=None, color=None, palette=None, legend=True, legend_out=True, sharex=True, sharey=True, margin_titles=False, facet_kws=None, **kwargs)
```
seaborn.catplot 是一个将分类图绘制到 FacetGrid 上图级别接口。
这个函数可以访问多个轴级功能,这些轴级功能通过不同的可视化图表展示数字和一个或多个分类变量的关系。`kind` 参数可以选择的轴级基础函数有:
分类散点图:
* [`stripplot()`](seaborn.stripplot.html#seaborn.stripplot "seaborn.stripplot") (with `kind="strip"`; the default)
* [`swarmplot()`](seaborn.swarmplot.html#seaborn.swarmplot "seaborn.swarmplot") (with `kind="swarm"`)
分类分布图:
* [`boxplot()`](seaborn.boxplot.html#seaborn.boxplot "seaborn.boxplot") (with `kind="box"`)
* [`violinplot()`](seaborn.violinplot.html#seaborn.violinplot "seaborn.violinplot") (with `kind="violin"`)
* [`boxenplot()`](seaborn.boxenplot.html#seaborn.boxenplot "seaborn.boxenplot") (with `kind="boxen"`)
分类估计图:
* [`pointplot()`](seaborn.pointplot.html#seaborn.pointplot "seaborn.pointplot") (with `kind="point"`)
* [`barplot()`](seaborn.barplot.html#seaborn.barplot "seaborn.barplot") (with `kind="bar"`)
* [`countplot()`](seaborn.countplot.html#seaborn.countplot "seaborn.countplot") (with `kind="count"`)
额外的关键字参数将传递给基础函数,因此,您应参阅每个文档,以查看特定类型的选项.
请注意,与直接使用轴级函数不同, 数据必须在长格式 DataFrame 中传递,并通过将字符串传递给 `x`, `y`, `hue`, 等指定的变量.
与基础绘图函数的情况一样, 如果变量有 `categorical` 数据类型, 则将从对象推断出分类变量的级别及其顺序。否则,您可能必须使用更改 dataframe 排序或使用函数参数(`orient`, `order`, `hue_order`, etc.) 来正确设置绘图。
此函数始终将其中一个变量视为分类,并在相关轴上的序数位置(0,1,... n)处绘制数据,即使数据具有数字或日期类型。
有关更多信息,请参考 [tutorial](http://seaborn.pydata.org/tutorial/categorical.html#categorical-tutorial)。
绘图后,返回带有绘图的 [`FacetGrid`](seaborn.FacetGrid.html#seaborn.FacetGrid "seaborn.FacetGrid"),可以直接用于调整绘图细节或添加其他图层。
参数:`x, y, hue`: `data` names 中的变量名称
> 用于绘制长格式数据的输入。查看解释示例
`data`:DataFrame
> 用于绘图的长形(整洁)数据集。每列应对应一个变量,每行应对应一个观察。
`row, col`:`data` 中的变量名称, 可选
> 分类变量将决定网格的分面。
`col_wrap`:int, 可选
> 以此宽度“包裹”列变量,以便列面跨越多行。 与`行`方面不兼容。
`estimator`:可调用的映射向量 -> 标量,可选
> 在每个分类箱内估计的统计函数。
`ci`:float 或“sd”或 None,可选
> 在估计值附近绘制置信区间的大小。如果是“sd”,则跳过自举(bootstrapping)并绘制观察的标准偏差。None,如果为`None`,则不执行自举,并且不会绘制错误条。
`n_boot`:int,可选
> 计算置信区间时使用的引导程序迭代次数。
`units`:`数据`或矢量数据中变量的名称,可选
>采样单元的标识符,用于执行多级引导程序并考虑重复测量设计。
`order, hue_order`:字符串列表,可选
> 命令绘制分类级别,否则从数据对象推断级别。
`row_order, col_order`:字符串列表,可选
>命令组织网格的行和/或列,否则从数据对象推断命令。
`kind`:字符串,可选
>要绘制的绘图类型(对应于分类绘图功能的名称。选项包括:“点”,“条形”,“条形”,“群”,“框”,“小提琴”或“盒子”。
`height`:标量,可选
> 每个刻面的高度(以英寸为单位)。另见: `aspect`。
`aspect`:标量,可选
> 每个面的纵横比,因此`aspect * height`给出每个面的宽度,单位为英寸。
`orient`:“v” | “h”, 可选
> 图的方向(垂直或水平)。这通常是从输入变量的 dtype 推断出来的,但可用于指定“分类”变量何时是数字或何时绘制宽格式数据。
`color`:matplotlib 颜色,可选
> 所有元素的颜色,或渐变调色板的种子。
`palette`:调色板名称,列表或字典,可选
> 用于色调变量的不同级别的颜色。应该是 [`color_palette()`](seaborn.color_palette.html#seaborn.color_palette "seaborn.color_palette"), 可以解释的东西,或者是将色调级别映射到 matplotlib 颜色的字典。
`legend`:bool, 可选
> 如果为 `True` 并且存在`hue`变量,则在图上绘制图例。t.
`legend_out`:bool, 可选
> 如果为`True`,则图形尺寸将被扩展,图例将绘制在中间右侧的图形之外。
`share{x,y}`:bool, ‘col’, 或 ‘row’ 可选
> 如果为 true,则 facet 将跨行跨越列和/或 x 轴共享 y 轴。
`margin_titles`:bool, 可选
> 如果为`True`,则行变量的标题将绘制在最后一列的右侧。此选项是实验性的,可能无法在所有情况下使用。
`facet_kws`:dict, 可选
> 传递给[`FacetGrid`](seaborn.FacetGrid.html#seaborn.FacetGrid "seaborn.FacetGrid")的其他关键字参数的字典。
`kwargs`:key, value 配对
> 其他关键字参数将传递给基础绘图函数。
返回值:`g`:[`FacetGrid`](seaborn.FacetGrid.html#seaborn.FacetGrid "seaborn.FacetGrid")
> 返回[`FacetGrid`](seaborn.FacetGrid.html#seaborn.FacetGrid "seaborn.FacetGrid")对象及其上的绘图以进一步调整。
例子
绘制单个构面以使用[`FacetGrid`](seaborn.FacetGrid.html#seaborn.FacetGrid "seaborn.FacetGrid")图例放置:
```py
>>> import seaborn as sns
>>> sns.set(style="ticks")
>>> exercise = sns.load_dataset("exercise")
>>> g = sns.catplot(x="time", y="pulse", hue="kind", data=exercise)
```

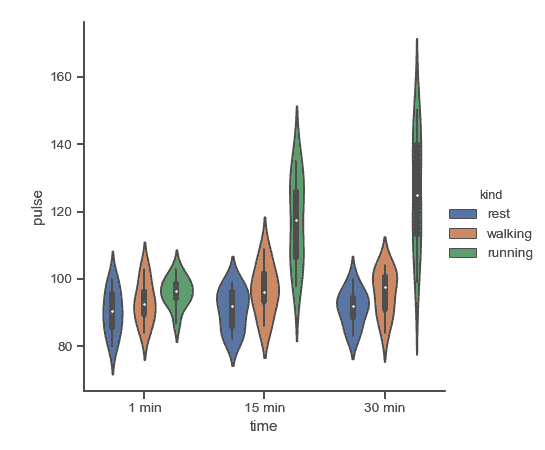
使用不同的绘图类型可视化相同的数据:
```py
>>> g = sns.catplot(x="time", y="pulse", hue="kind",
... data=exercise, kind="violin")
```
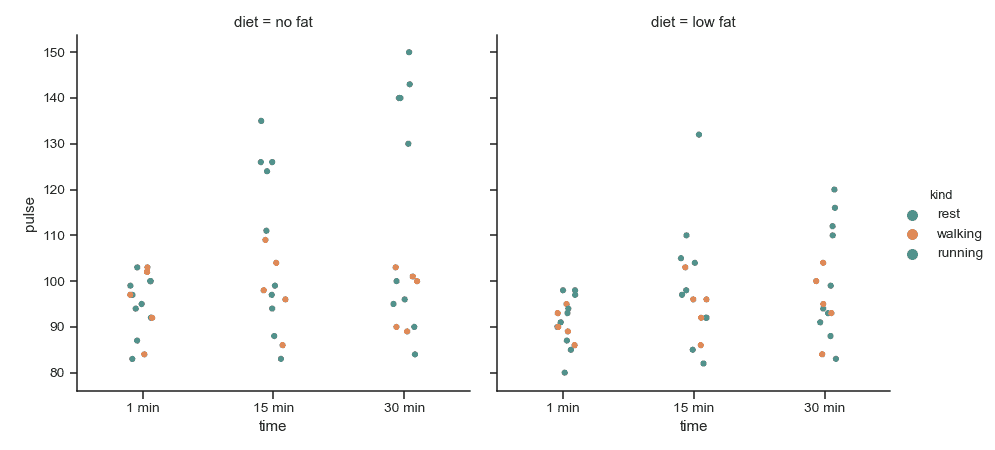
沿列的方面显示第三个分类变量:
```py
>>> g = sns.catplot(x="time", y="pulse", hue="kind",
... col="diet", data=exercise)
```
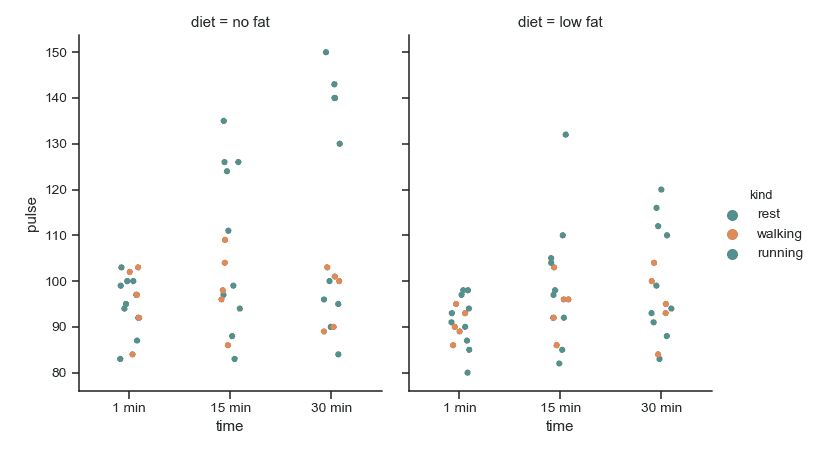
为构面使用不同的高度和宽高比:
```py
>>> g = sns.catplot(x="time", y="pulse", hue="kind",
... col="diet", data=exercise,
... height=5, aspect=.8)
```
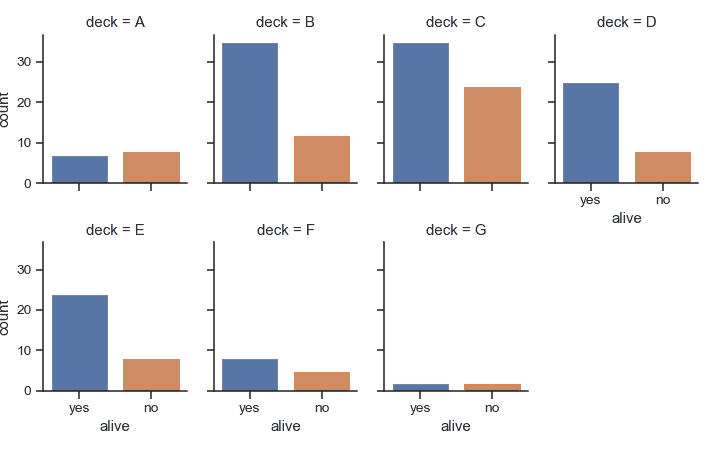
创建许多列构面并将它们包装到网格的行中:
```py
>>> titanic = sns.load_dataset("titanic")
>>> g = sns.catplot("alive", col="deck", col_wrap=4,
... data=titanic[titanic.deck.notnull()],
... kind="count", height=2.5, aspect=.8)
```
水平绘图并将其他关键字参数传递给绘图函数:
```py
>>> g = sns.catplot(x="age", y="embark_town",
... hue="sex", row="class",
... data=titanic[titanic.embark_town.notnull()],
... orient="h", height=2, aspect=3, palette="Set3",
... kind="violin", dodge=True, cut=0, bw=.2)
```

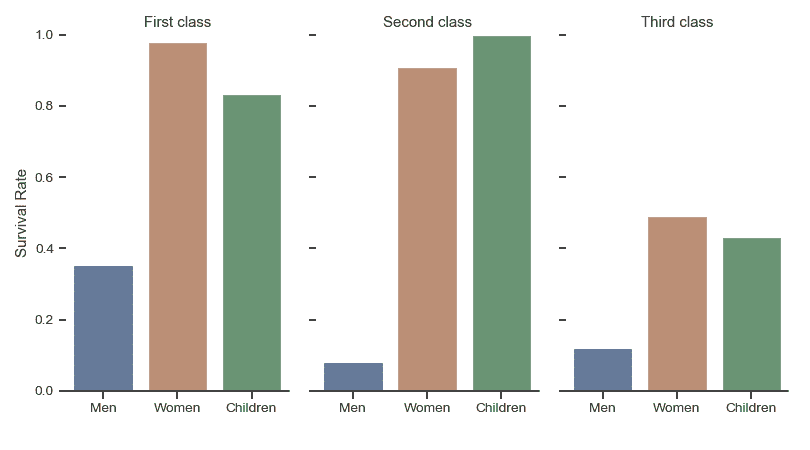
使用返回的[`FacetGrid`](seaborn.FacetGrid.html#seaborn.FacetGrid "seaborn.FacetGrid") 上的方法来调整演示文稿:
```py
>>> g = sns.catplot(x="who", y="survived", col="class",
... data=titanic, saturation=.5,
... kind="bar", ci=None, aspect=.6)
>>> (g.set_axis_labels("", "Survival Rate")
... .set_xticklabels(["Men", "Women", "Children"])
... .set_titles("{col_name} {col_var}")
... .set(ylim=(0, 1))
... .despine(left=True))
<seaborn.axisgrid.FacetGrid object at 0x...>
```
- seaborn 0.9 中文文档
- Seaborn 简介
- 安装和入门
- 可视化统计关系
- 可视化分类数据
- 可视化数据集的分布
- 线性关系可视化
- 构建结构化多图网格
- 控制图像的美学样式
- 选择调色板
- seaborn.relplot
- seaborn.scatterplot
- seaborn.lineplot
- seaborn.catplot
- seaborn.stripplot
- seaborn.swarmplot
- seaborn.boxplot
- seaborn.violinplot
- seaborn.boxenplot
- seaborn.pointplot
- seaborn.barplot
- seaborn.countplot
- seaborn.jointplot
- seaborn.pairplot
- seaborn.distplot
- seaborn.kdeplot
- seaborn.rugplot
- seaborn.lmplot
- seaborn.regplot
- seaborn.residplot
- seaborn.heatmap
- seaborn.clustermap
- seaborn.FacetGrid
- seaborn.FacetGrid.map
- seaborn.FacetGrid.map_dataframe
- seaborn.PairGrid
- seaborn.PairGrid.map
- seaborn.PairGrid.map_diag
- seaborn.PairGrid.map_offdiag
- seaborn.PairGrid.map_lower
- seaborn.PairGrid.map_upper
- seaborn.JointGrid
- seaborn.JointGrid.plot
- seaborn.JointGrid.plot_joint
- seaborn.JointGrid.plot_marginals
- seaborn.set
- seaborn.axes_style
- seaborn.set_style
- seaborn.plotting_context
- seaborn.set_context
- seaborn.set_color_codes
- seaborn.reset_defaults
- seaborn.reset_orig
- seaborn.set_palette
- seaborn.color_palette
- seaborn.husl_palette
- seaborn.hls_palette
- seaborn.cubehelix_palette
- seaborn.dark_palette
- seaborn.light_palette
- seaborn.diverging_palette
- seaborn.blend_palette
- seaborn.xkcd_palette
- seaborn.crayon_palette
- seaborn.mpl_palette
- seaborn.choose_colorbrewer_palette
- seaborn.choose_cubehelix_palette
- seaborn.choose_light_palette
- seaborn.choose_dark_palette
- seaborn.choose_diverging_palette
- seaborn.load_dataset
- seaborn.despine
- seaborn.desaturate
- seaborn.saturate
- seaborn.set_hls_values
