# seaborn.clustermap
> 译者:[cancan233](https://github.com/cancan233)
```py
seaborn.clustermap(data, pivot_kws=None, method='average', metric='euclidean', z_score=None, standard_scale=None, figsize=None, cbar_kws=None, row_cluster=True, col_cluster=True, row_linkage=None, col_linkage=None, row_colors=None, col_colors=None, mask=None, **kwargs)
```
将矩阵数据集绘制成分层聚类热图。
参数:**data:2D array-like**
> 用于聚类的矩形数据,不能包含 NA。
`pivot_kws`:字典,可选。
> 如果数据是整齐的数据框架,可以为 pivot 提供关键字参数以创建矩形数据框架。
`method`:字符串,可选。
> 用于计算聚类的链接方法。有关更多信息,请参阅文档 scipy.cluster.hierarchy.linkage [https://docs.scipy.org/doc/scipy/reference/generated/scipy.cluster.hierarchy.linkage.html](https://docs.scipy.org/doc/scipy/reference/generated/scipy.cluster.hierarchy.linkage.html)
`metric`:字符串,可选。
> 用于数据的距离度量。有关更多选项,请参阅 scipy.spatial.distance.pdist 文档。 [https://docs.scipy.org/doc/scipy/reference/generated/scipy.spatial.distance.pdist.html](https://docs.scipy.org/doc/scipy/reference/generated/scipy.spatial.distance.pdist.html) 要对行和列使用不同的度量(或方法),您可以子集构造每个链接矩阵,并将它们提供为`{row, col}_linkage.`
`z_score`:int 或 None,可选。
> 0(行)或 1(列)。是否计算行或列的 z 分数。Z 得分为 z = (x - mean)/std,因此每行(列)中的值将减去行(列)的平均值,然后除以行(列)的标准偏差。这可确保每行(列)的均值为 0,方差为 1.
`standard_scale`:int 或 None, 可选。
> 0(行)或 1(列)。是否标准化该维度,即每行或每列的含义,减去最小值并将每个维度除以其最大值。
**figsize: 两个整数的元组, 可选。**
> 要创建的图形的大小。
`cbar_kws`:字典, 可选。
> 要传递给`heatmap`中的`cbar_kws`的关键字参数,例如向彩条添加标签。
`{row,col}_cluster`:布尔值, 可选。
> 如果为真,则对{rows, columns}进行聚类。
`{row,col}_linkage`:numpy.array, 可选。
> 行或列的预计算链接矩阵。有关特定格式,请参阅 scipy.cluster.hierarchy.linkage.
`{row,col}_colors`:list-like 或 pandas DataFrame/Series, 可选。
> 要为行或列标记的颜色列表。用于评估组内的样本是否聚集在一起。可以使用嵌套列表或 DataFrame 进行多种颜色级别的标注。如果以 DataFrame 或 Series 形式提供,则从 DataFrames 列名称或 Series 的名称中提取颜色标签。DataFrame/Series 颜色也通过索引与数据匹配,确保以正确的顺序绘制颜色。
`mask`:布尔数组或 DataFrame, 可选。
> 如果通过,数据将不会显示在`mask`为真的单元格中。具有缺失值的单元格将自动被屏蔽。仅用于可视化,不用于计算。
`kwargs`:其他关键字参数。
> 所有其他关键字参数都传递给`sns.heatmap`
返回值:`clustergrid`:ClusterGrid
> ClusterGrid 实例。
注意点:
返回的对象有一个`savefig`方法,如果要保存图形对象而不剪切树形图,则应使用该方法。
要访问重新排序的行索引,请使用:`clustergrid.dendrogram_row.reordered_in`
列索引, 请使用: `clustergrid.dendrogram_col.reordered_ind`
范例
绘制聚类热图。
```py
>>> import seaborn as sns; sns.set(color_codes=True)
>>> iris = sns.load_dataset("iris")
>>> species = iris.pop("species")
>>> g = sns.clustermap(iris)
```
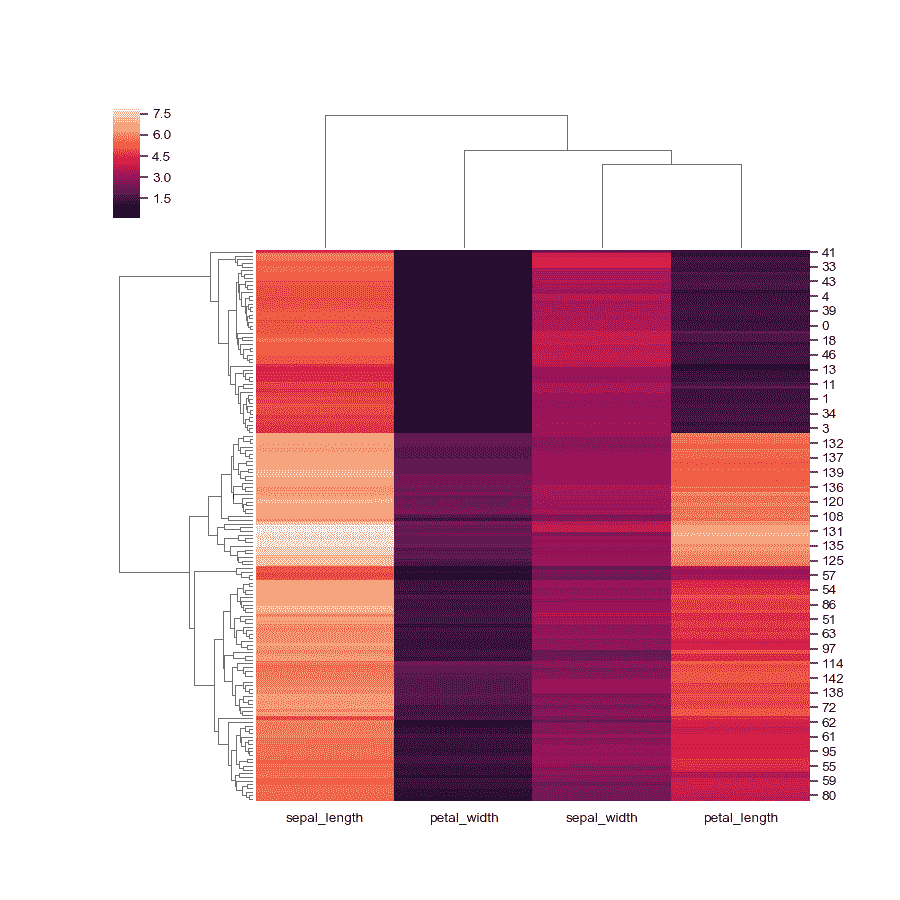
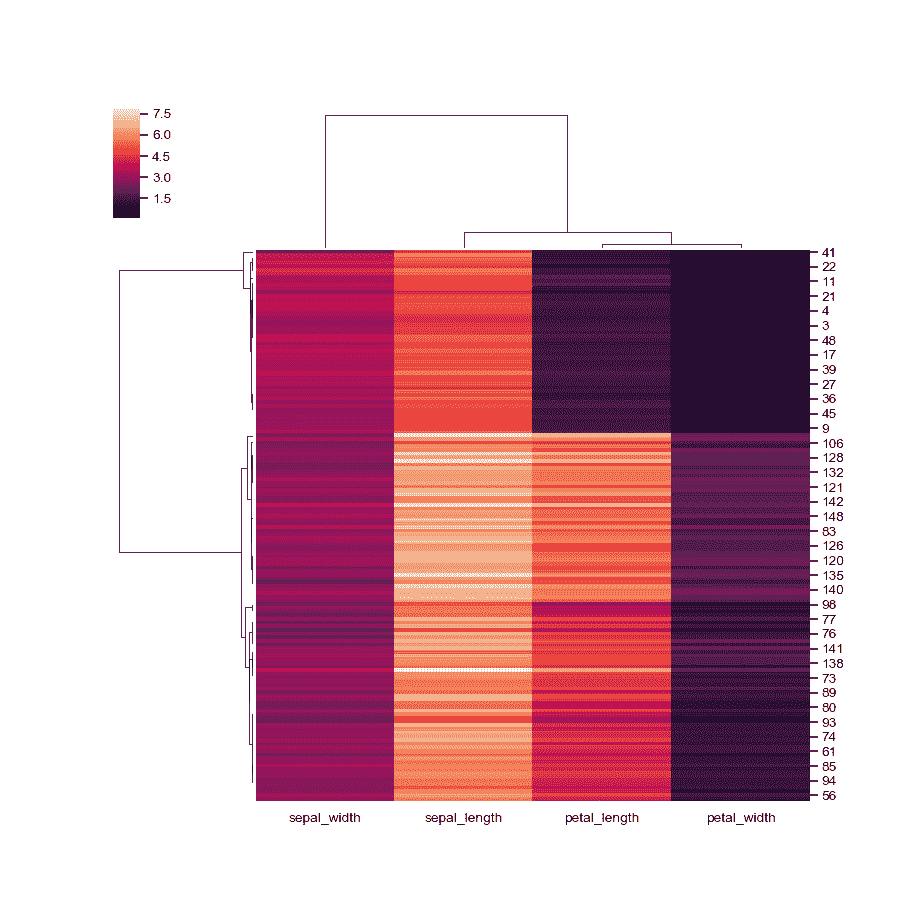
使用不同的相似性指标。
```py
>>> g = sns.clustermap(iris, metric="correlation")
```
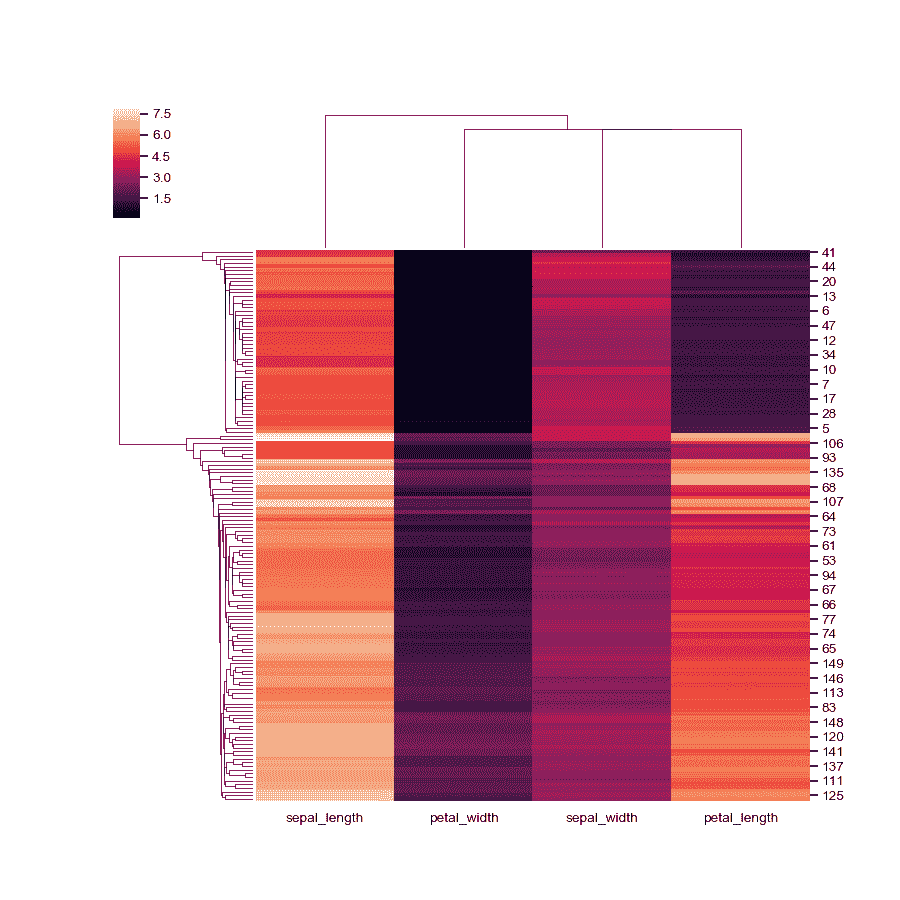
使用不同的聚类方法。
```py
>>> g = sns.clustermap(iris, method="single")
```
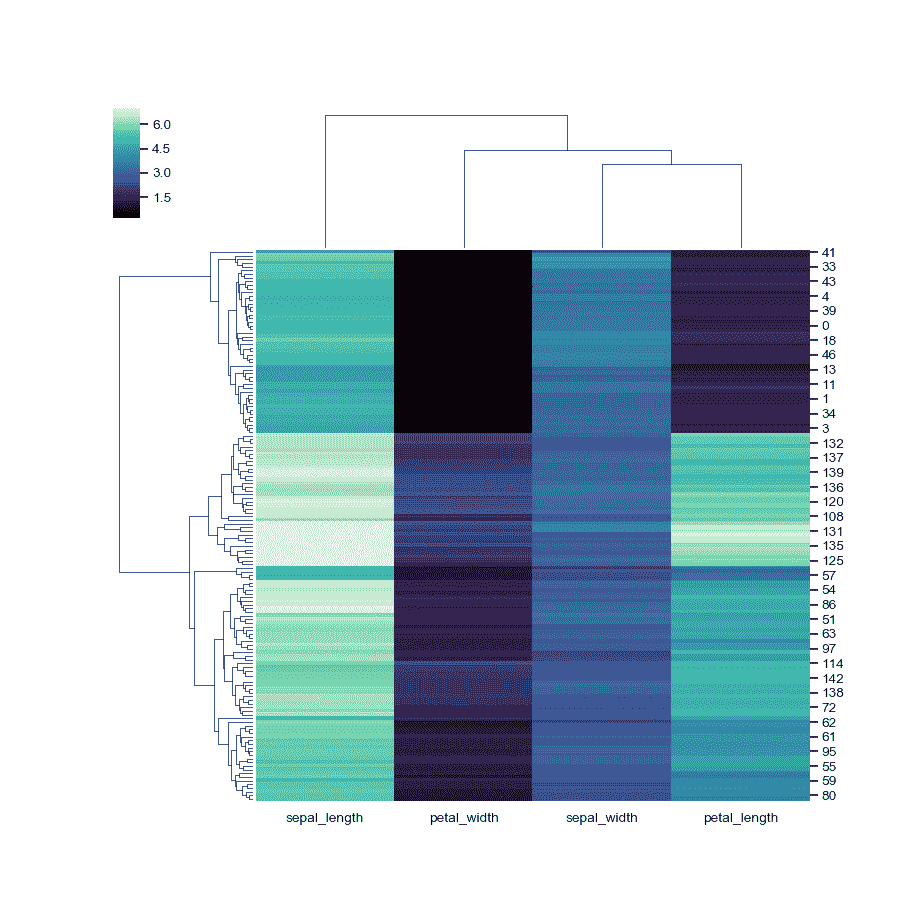
使用不同的色彩映射并忽略色彩映射限制中的异常值。
```py
>>> g = sns.clustermap(iris, cmap="mako", robust=True)
```
改变图的大小。
```py
>>> g = sns.clustermap(iris, figsize=(6, 7))
```
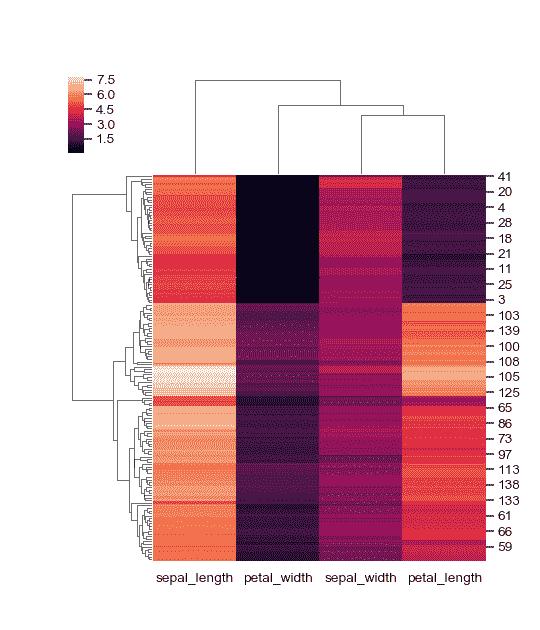
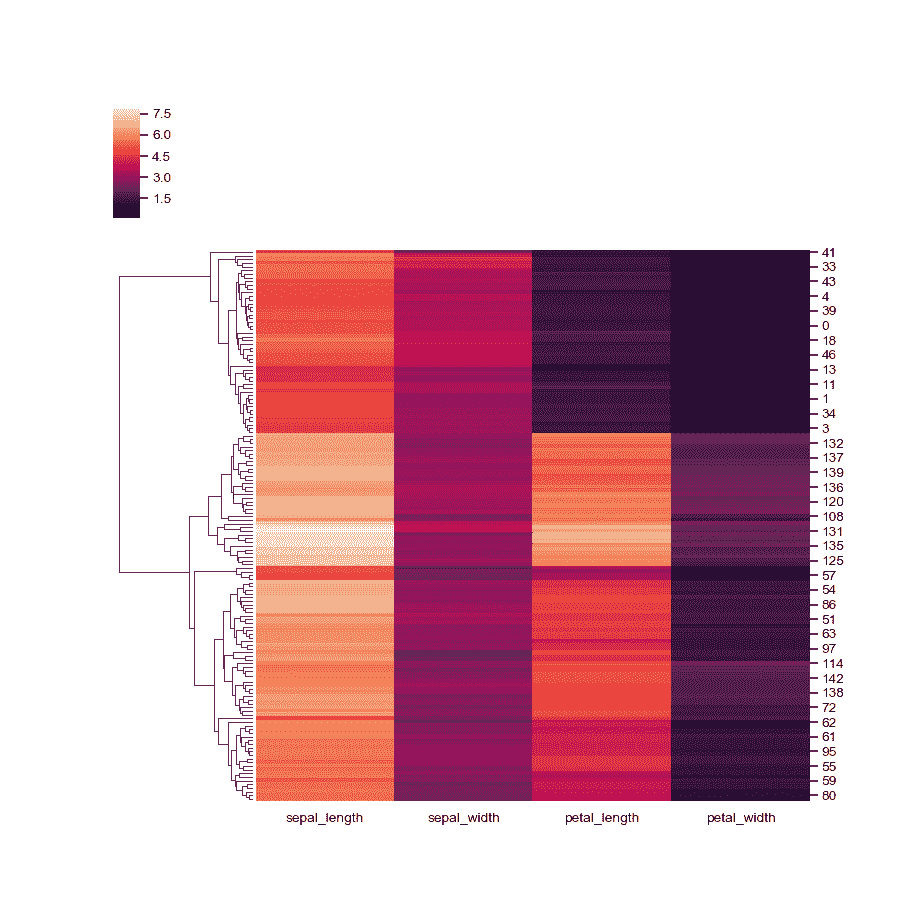
绘制其原始组织中的一个轴。
```py
>>> g = sns.clustermap(iris, col_cluster=False)
```
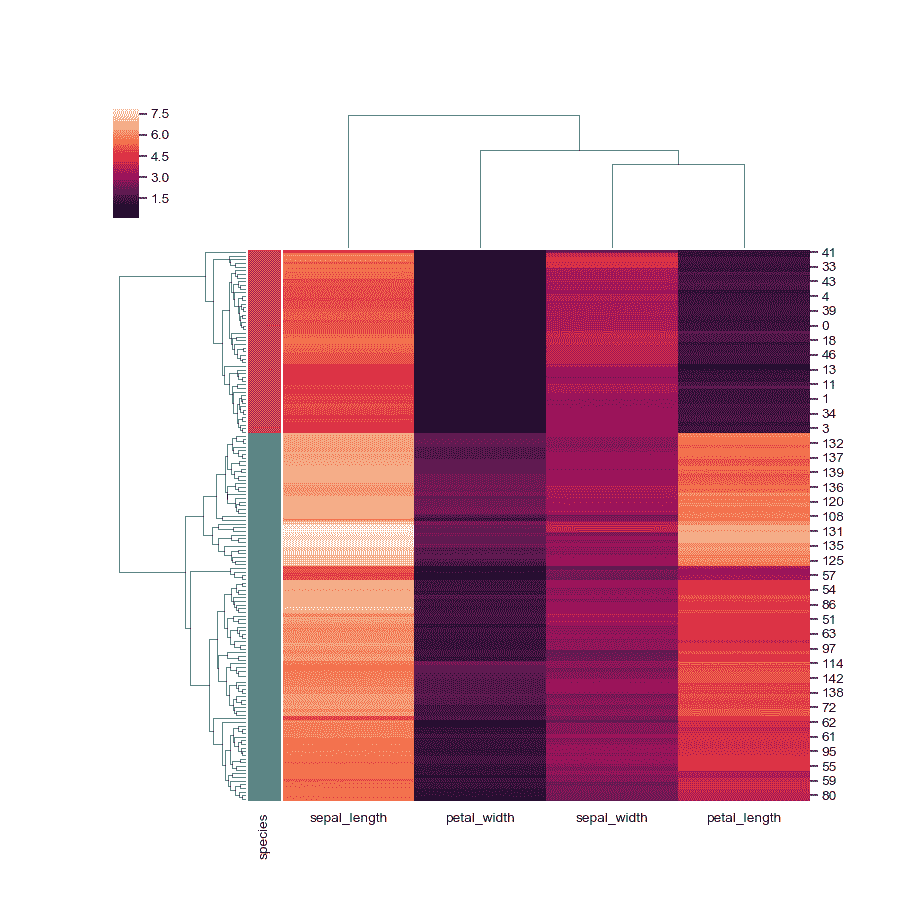
添加彩色标签。
```py
>>> lut = dict(zip(species.unique(), "rbg"))
>>> row_colors = species.map(lut)
>>> g = sns.clustermap(iris, row_colors=row_colors)
```
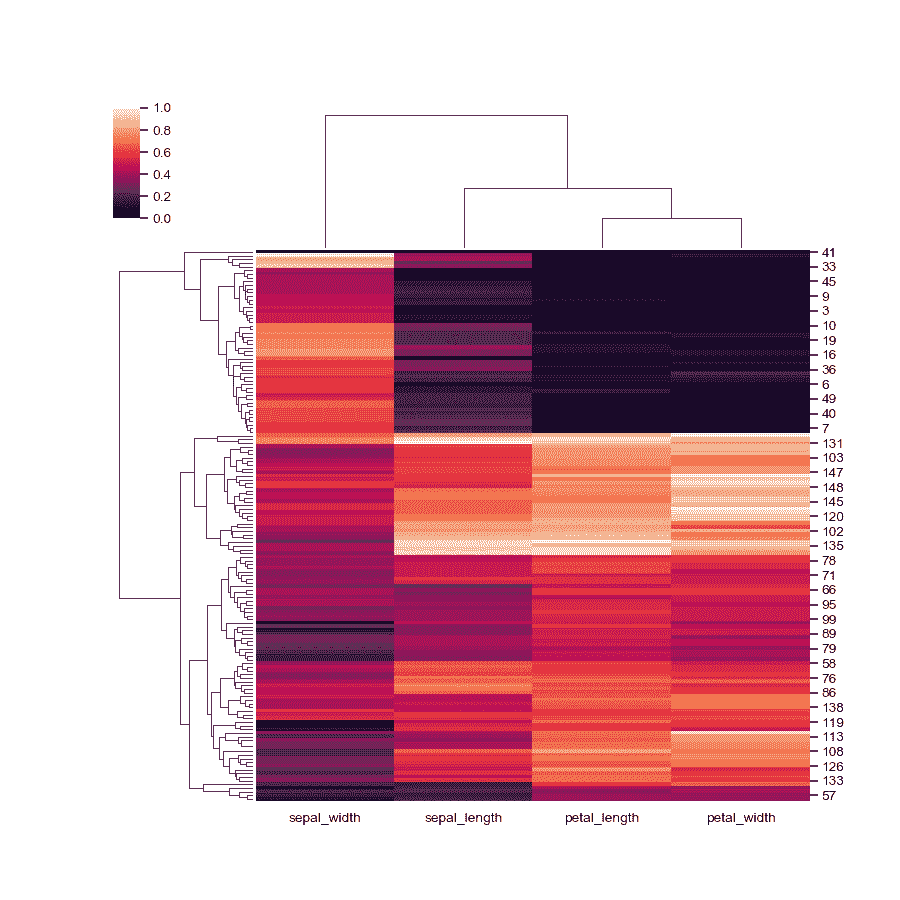
标准化列中的数据。
```py
>>> g = sns.clustermap(iris, standard_scale=1)
```
正规化行内数据。
```py
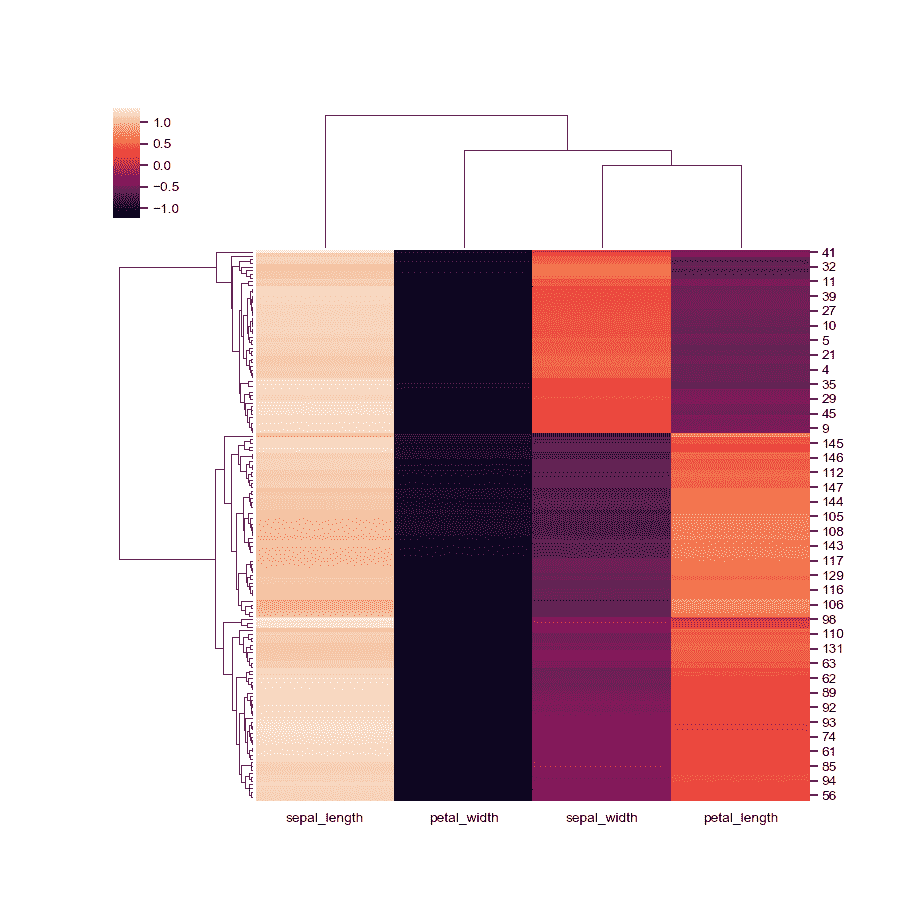
>>> g = sns.clustermap(iris, z_score=0)
```
- seaborn 0.9 中文文档
- Seaborn 简介
- 安装和入门
- 可视化统计关系
- 可视化分类数据
- 可视化数据集的分布
- 线性关系可视化
- 构建结构化多图网格
- 控制图像的美学样式
- 选择调色板
- seaborn.relplot
- seaborn.scatterplot
- seaborn.lineplot
- seaborn.catplot
- seaborn.stripplot
- seaborn.swarmplot
- seaborn.boxplot
- seaborn.violinplot
- seaborn.boxenplot
- seaborn.pointplot
- seaborn.barplot
- seaborn.countplot
- seaborn.jointplot
- seaborn.pairplot
- seaborn.distplot
- seaborn.kdeplot
- seaborn.rugplot
- seaborn.lmplot
- seaborn.regplot
- seaborn.residplot
- seaborn.heatmap
- seaborn.clustermap
- seaborn.FacetGrid
- seaborn.FacetGrid.map
- seaborn.FacetGrid.map_dataframe
- seaborn.PairGrid
- seaborn.PairGrid.map
- seaborn.PairGrid.map_diag
- seaborn.PairGrid.map_offdiag
- seaborn.PairGrid.map_lower
- seaborn.PairGrid.map_upper
- seaborn.JointGrid
- seaborn.JointGrid.plot
- seaborn.JointGrid.plot_joint
- seaborn.JointGrid.plot_marginals
- seaborn.set
- seaborn.axes_style
- seaborn.set_style
- seaborn.plotting_context
- seaborn.set_context
- seaborn.set_color_codes
- seaborn.reset_defaults
- seaborn.reset_orig
- seaborn.set_palette
- seaborn.color_palette
- seaborn.husl_palette
- seaborn.hls_palette
- seaborn.cubehelix_palette
- seaborn.dark_palette
- seaborn.light_palette
- seaborn.diverging_palette
- seaborn.blend_palette
- seaborn.xkcd_palette
- seaborn.crayon_palette
- seaborn.mpl_palette
- seaborn.choose_colorbrewer_palette
- seaborn.choose_cubehelix_palette
- seaborn.choose_light_palette
- seaborn.choose_dark_palette
- seaborn.choose_diverging_palette
- seaborn.load_dataset
- seaborn.despine
- seaborn.desaturate
- seaborn.saturate
- seaborn.set_hls_values
