## 原理
[17.log-center模块](14.log-center.md)
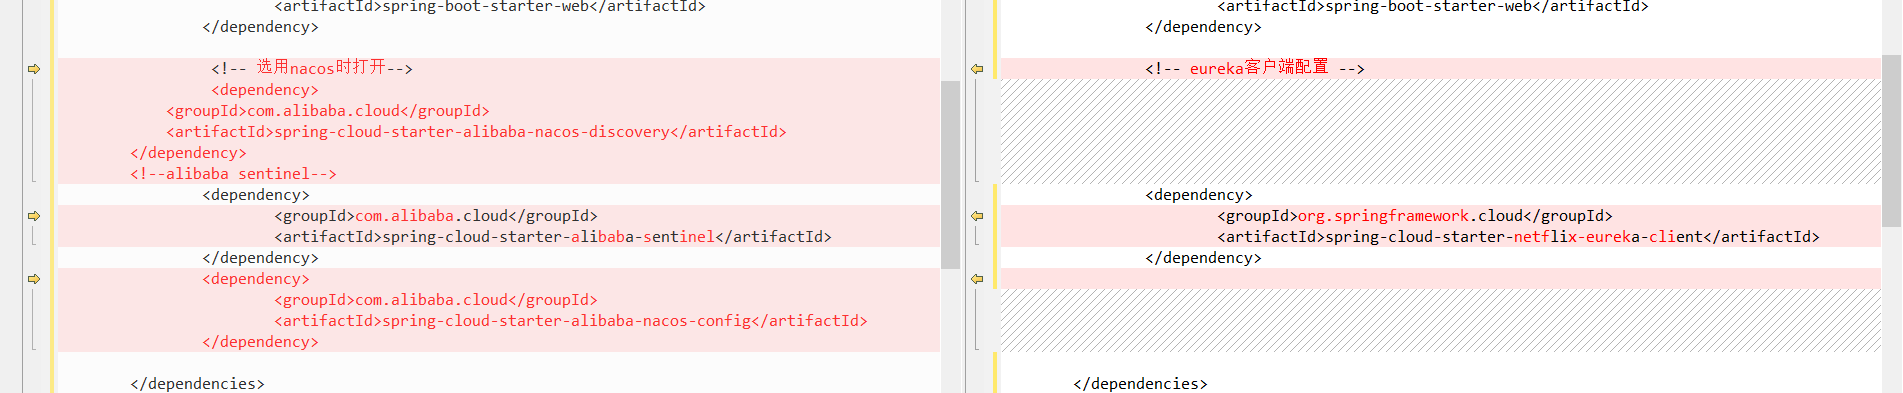
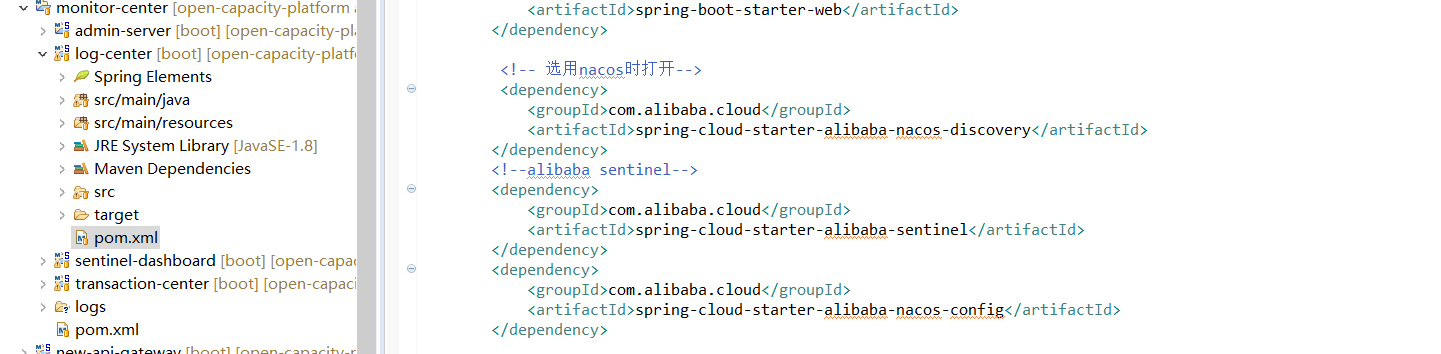
## 改依赖
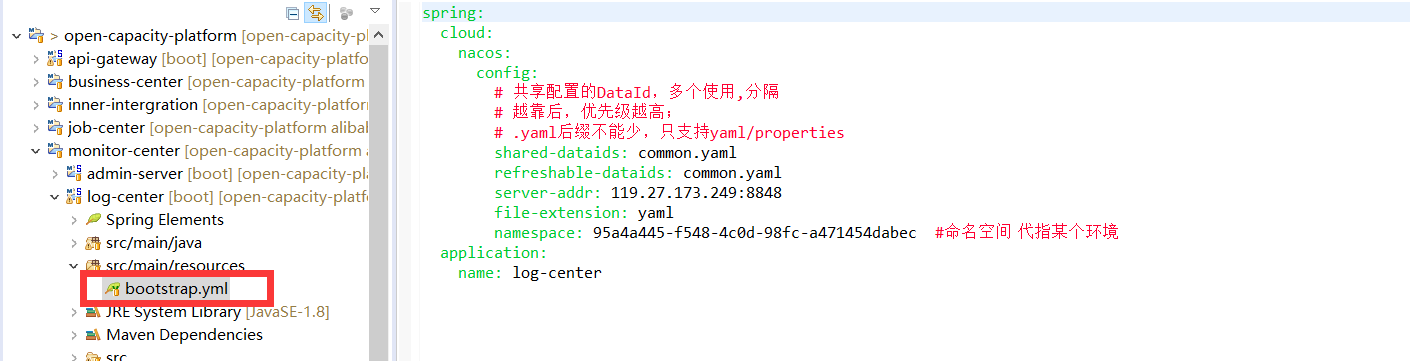
## 改配置
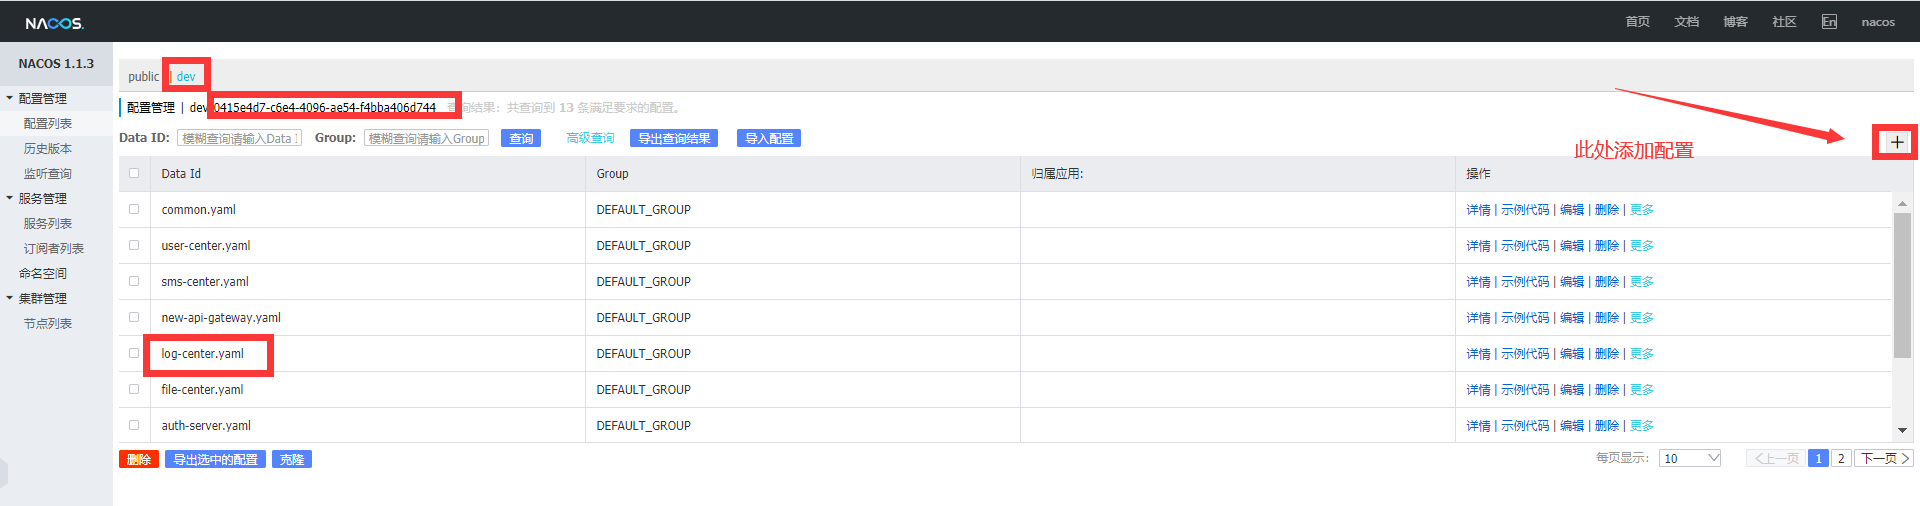
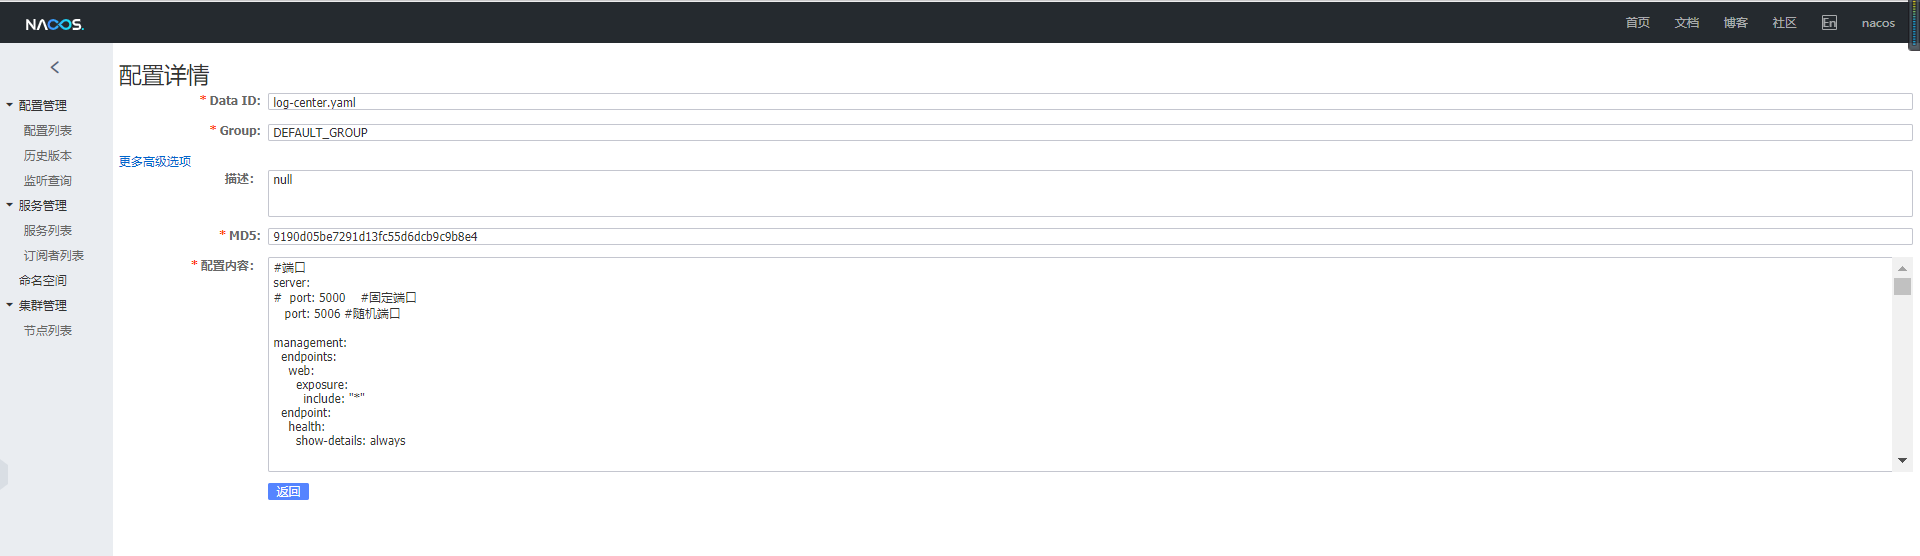
log-center.yaml
```
#端口
server:
# port: 5000 #固定端口
port: 5006 #随机端口
management:
endpoints:
web:
exposure:
include: "*"
endpoint:
health:
show-details: always
spring:
datasource:
druid:
# JDBC 配置(驱动类自动从url的mysql识别,数据源类型自动识别)
url: jdbc:mysql://59.110.164.254:3306/log-center?useUnicode=true&characterEncoding=utf-8&allowMultiQueries=true&useSSL=false
username: root
password: root
driver-class-name: com.mysql.cj.jdbc.Driver
#连接池配置(通常来说,只需要修改initialSize、minIdle、maxActive
initial-size: 1
max-active: 20
min-idle: 1
# 配置获取连接等待超时的时间
max-wait: 60000
#打开PSCache,并且指定每个连接上PSCache的大小
pool-prepared-statements: true
max-pool-prepared-statement-per-connection-size: 20
validation-query: SELECT 'x'
test-on-borrow: false
test-on-return: false
test-while-idle: true
#配置间隔多久才进行一次检测,检测需要关闭的空闲连接,单位是毫秒
time-between-eviction-runs-millis: 60000
#配置一个连接在池中最小生存的时间,单位是毫秒
min-evictable-idle-time-millis: 300000
filters: stat,wall
# WebStatFilter配置,说明请参考Druid Wiki,配置_配置WebStatFilter
#是否启用StatFilter默认值true
web-stat-filter.enabled: true
web-stat-filter.url-pattern: /*
web-stat-filter.exclusions: "*.js , *.gif ,*.jpg ,*.png ,*.css ,*.ico , /druid/*"
web-stat-filter.session-stat-max-count: 1000
web-stat-filter.profile-enable: true
# StatViewServlet配置
#展示Druid的统计信息,StatViewServlet的用途包括:1.提供监控信息展示的html页面2.提供监控信息的JSON API
#是否启用StatViewServlet默认值true
stat-view-servlet.enabled: true
#根据配置中的url-pattern来访问内置监控页面,如果是上面的配置,内置监控页面的首页是/druid/index.html例如:
#http://110.76.43.235:9000/druid/index.html
#http://110.76.43.235:8080/mini-web/druid/index.html
stat-view-servlet.url-pattern: /druid/*
#允许清空统计数据
stat-view-servlet.reset-enable: true
stat-view-servlet.login-username: admin
stat-view-servlet.login-password: admin
#StatViewSerlvet展示出来的监控信息比较敏感,是系统运行的内部情况,如果你需要做访问控制,可以配置allow和deny这两个参数
#deny优先于allow,如果在deny列表中,就算在allow列表中,也会被拒绝。如果allow没有配置或者为空,则允许所有访问
#配置的格式
#<IP>
#或者<IP>/<SUB_NET_MASK_size>其中128.242.127.1/24
#24表示,前面24位是子网掩码,比对的时候,前面24位相同就匹配,不支持IPV6。
#stat-view-servlet.allow=
#stat-view-servlet.deny=128.242.127.1/24,128.242.128.1
# Spring监控配置,说明请参考Druid Github Wiki,配置_Druid和Spring关联监控配置
#aop-patterns= # Spring监控AOP切入点,如x.y.z.service.*,配置多个英文逗号分隔
################### mysq end ##########################
redis:
################### redis 单机版 start ##########################
host: 59.110.164.254
port: 6379
timeout: 6000
database: 8
lettuce:
pool:
max-active: 10 # 连接池最大连接数(使用负值表示没有限制),如果赋值为-1,则表示不限制;如果pool已经分配了maxActive个jedis实例,则此时pool的状态为exhausted(耗尽)
max-idle: 8 # 连接池中的最大空闲连接 ,默认值也是8
max-wait: 100 # # 等待可用连接的最大时间,单位毫秒,默认值为-1,表示永不超时。如果超过等待时间,则直接抛出JedisConnectionException
min-idle: 2 # 连接池中的最小空闲连接 ,默认值也是0
shutdown-timeout: 100ms
################### redis 单机版 end ##########################
# cluster:
# nodes: 130.75.131.237:7000,130.75.131.238:7000,130.75.131.239:7000,130.75.131.237:7001,130.75.131.238:7001,130.75.131.239:7001
# #130.75.131.237:7000,130.75.131.238:7000,130.75.131.239:7000,130.75.131.237:7001,130.75.131.238:7001,130.75.131.239:7001
# #192.168.3.157:7000,192.168.3.158:7000,192.168.3.159:7000,192.168.3.157:7001,192.168.3.158:7001,192.168.3.159:7001
# timeout: 1000 # 连接超时时间(毫秒)
# lettuce:
# pool:
# max-active: 10 # 连接池最大连接数(使用负值表示没有限制),如果赋值为-1,则表示不限制;如果pool已经分配了maxActive个jedis实例,则此时pool的状态为exhausted(耗尽)
# max-idle: 8 # 连接池中的最大空闲连接 ,默认值也是8
# max-wait: 100 # # 等待可用连接的最大时间,单位毫秒,默认值为-1,表示永不超时。如果超过等待时间,则直接抛出JedisConnectionException
# min-idle: 2 # 连接池中的最小空闲连接 ,默认值也是0
# shutdown-timeout: 100ms
# zipkin:
# base-url: http://127.0.0.1:11008
#elasticsearch服务配置
data:
elasticsearch:
cluster-name: elasticsearch
cluster-nodes: 47.99.88.28:9300
repositories:
enabled: true
properties:
transport:
tcp:
connect_timeout: 120s
# 设置连接超时时间
##spring.data.elasticsearch.properties.transport.tcp.connect_timeout=120s
# http:
# multipart:
# enabled: true
# max-file-size: 2MB
# max-request-size: 10MB
# file-size-threshold: 5MB
security:
oauth2:
ignored: /files-anon/** , /doc.html ,/upload.html , /uploads.html ,/js/** ,/document.html
token:
store:
type: redis
mybatis-plus:
global-config:
banner: false
mapper-locations: classpath*:com/open/**/dao/*.xml
#设置最大超时时间
ribbon:
ServerListRefreshInterval: 10 #刷新服务列表源的间隔时间
httpclient:
enabled: false
okhttp:
enabled: true
ReadTimeout: 90000
ConnectTimeout: 90000
OkToRetryOnAllOperations: true
MaxAutoRetries: 1
MaxAutoRetriesNextServer: 1
#设置最大容错超时时间
hystrix:
command:
default:
execution:
timeout:
enabled: true
isolation:
thread:
timeoutInMilliseconds: 90000
logging:
level:
com.open.capacity: INFO
org.hibernate: INFO
org.hibernate.type.descriptor.sql.BasicBinder: TRACE
org.hibernate.type.descriptor.sql.BasicExtractor: TRACE
# com.neusoft: DEBUG
# com.netflix: DEBUG #用于心跳检测输出的日志
```
## 启动
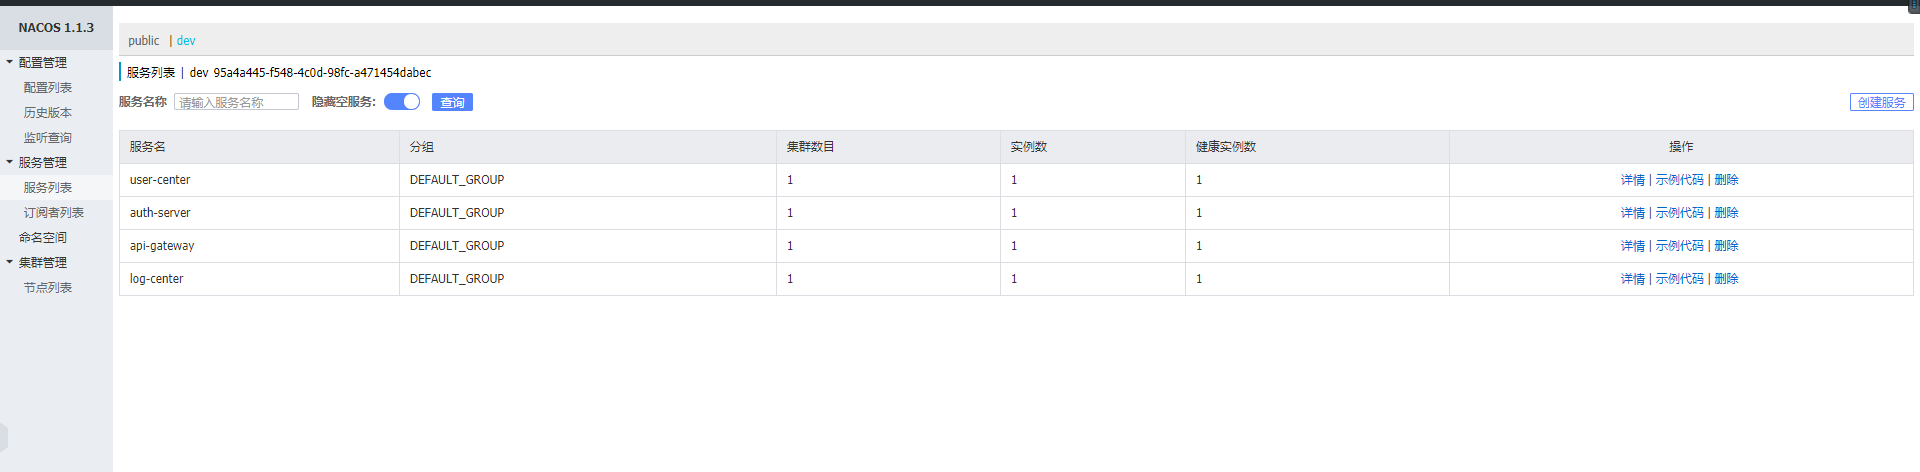
## log-center内部原理请参考03.模块详解部分
- 前言
- 1.项目说明
- 2.项目更新日志
- 3.文档更新日志
- 01.快速开始
- 01.maven构建项目
- 02.环境安装
- 03.STS项目导入
- 03.IDEA项目导入
- 04.数据初始化
- 05.项目启动
- 06.付费文档说明
- 02.总体流程
- 1.oauth接口
- 2.架构设计图
- 3.微服务介绍
- 4.功能介绍
- 5.梳理流程
- 03.模块详解
- 01.老版本1.0.1分支模块讲解
- 01.db-core模块
- 02.api-commons模块
- 03.log-core模块
- 04.security-core模块
- 05.swagger-core模块
- 06.eureka-server模块
- 07.auth-server模块
- 08.auth-sso模块解析
- 09.user-center模块
- 10.api-gateway模块
- 11.file-center模块
- 12.log-center模块
- 13.batch-center模块
- 14.back-center模块
- 02.spring-boot-starter-web那点事
- 03.自定义db-spring-boot-starter
- 04.自定义log-spring-boot-starter
- 05.自定义redis-spring-boot-starter
- 06.自定义common-spring-boot-starter
- 07.自定义swagger-spring-boot-starter
- 08.自定义uaa-server-spring-boot-starter
- 09.自定义uaa-client-spring-boot-starter
- 10.自定义ribbon-spring-boot-starter
- 11.springboot启动原理
- 12.eureka-server模块
- 13.auth-server模块
- 14.user-center模块
- 15.api-gateway模块
- 16.file-center模块
- 17.log-center模块
- 18.back-center模块
- 19.auth-sso模块
- 20.admin-server模块
- 21.zipkin-center模块
- 22.job-center模块
- 23.batch-center
- 04.全新网关
- 01.基于spring cloud gateway的new-api-gateway
- 02.spring cloud gateway整合Spring Security Oauth
- 03.基于spring cloud gateway的redis动态路由
- 04.spring cloud gateway聚合swagger文档
- 05.技术详解
- 01.互联网系统设计原则
- 02.系统幂等性设计与实践
- 03.Oauth最简向导开发指南
- 04.oauth jdbc持久化策略
- 05.JWT token方式启用
- 06.token有效期的处理
- 07.@PreAuthorize注解分析
- 08.获取当前用户信息
- 09.认证授权白名单配置
- 10.OCP权限设计
- 11.服务安全流程
- 12.认证授权详解
- 13.验证码技术
- 14.短信验证码登录
- 15.动态数据源配置
- 16.分页插件使用
- 17.缓存击穿
- 18.分布式主键生成策略
- 19.分布式定时任务
- 20.分布式锁
- 21.网关多维度限流
- 22.跨域处理
- 23.容错限流
- 24.应用访问次数控制
- 25.统一业务异常处理
- 26.日志埋点
- 27.GPRC内部通信
- 28.服务间调用
- 29.ribbon负载均衡
- 30.微服务分布式跟踪
- 31.异步与线程传递变量
- 32.死信队列延时消息
- 33.单元测试用例
- 34.Greenwich.RELEASE升级
- 35.混沌工程质量保证
- 06.开发初探
- 1.开发技巧
- 2.crud例子
- 3.新建服务
- 4.区分前后台用户
- 07.分表分库
- 08.分布式事务
- 1.Seata介绍
- 2.Seata部署
- 09.shell部署
- 01.eureka-server
- 02.user-center
- 03.auth-server
- 04.api-gateway
- 05.file-center
- 06.log-center
- 07.back-center
- 08.编写shell脚本
- 09.集群shell部署
- 10.集群shell启动
- 11.部署阿里云问题
- 10.网关安全
- 1.openresty https保障服务安全
- 2.openresty WAF应用防火墙
- 3.openresty 高可用
- 11.docker配置
- 01.docker安装
- 02.Docker 开启远程API
- 03.采用docker方式打包到服务器
- 04.docker创建mysql
- 05.docker网络原理
- 06.docker实战
- 6.01.安装docker
- 6.02.管理镜像基本命令
- 6.03.容器管理
- 6.04容器数据持久化
- 6.05网络模式
- 6.06.Dockerfile
- 6.07.harbor部署
- 6.08.使用自定义镜像
- 12.统一监控中心
- 01.spring boot admin监控
- 02.Arthas诊断利器
- 03.nginx监控(filebeat+es+grafana)
- 04.Prometheus监控
- 05.redis监控(redis+prometheus+grafana)
- 06.mysql监控(mysqld_exporter+prometheus+grafana)
- 07.elasticsearch监控(elasticsearch-exporter+prometheus+grafana)
- 08.linux监控(node_exporter+prometheus+grafana)
- 09.micoservice监控
- 10.nacos监控
- 11.druid数据源监控
- 12.prometheus.yml
- 13.grafana告警
- 14.Alertmanager告警
- 15.监控微信告警
- 16.关于接口监控告警
- 17.prometheus-HA架构
- 18.总结
- 13.统一日志中心
- 01.统一日志中心建设意义
- 02.通过ELK收集mysql慢查询日志
- 03.通过elk收集微服务模块日志
- 04.通过elk收集nginx日志
- 05.统一日志中心性能优化
- 06.kibana安装部署
- 07.日志清理方案
- 08.日志性能测试指标
- 09.总结
- 14.数据查询平台
- 01.数据查询平台架构
- 02.mysql配置bin-log
- 03.单节点canal-server
- 04.canal-ha部署
- 05.canal-kafka部署
- 06.实时增量数据同步mysql
- 07.canal监控
- 08.clickhouse运维常见脚本
- 15.APM监控
- 1.Elastic APM
- 2.Skywalking
- 01.docker部署es
- 02.部署skywalking-server
- 03.部署skywalking-agent
- 16.压力测试
- 1.ocp.jmx
- 2.test.bat
- 3.压测脚本
- 4.压力报告
- 5.报告分析
- 6.压测平台
- 7.并发测试
- 8.wrk工具
- 9.nmon
- 10.jmh测试
- 17.SQL优化
- 1.oracle篇
- 01.基线测试
- 02.调优前奏
- 03.线上瓶颈定位
- 04.执行计划解读
- 05.高级SQL语句
- 06.SQL tuning
- 07.数据恢复
- 08.深入10053事件
- 09.深入10046事件
- 2.mysql篇
- 01.innodb存储引擎
- 02.BTree索引
- 03.执行计划
- 04.查询优化案例分析
- 05.为什么会走错索引
- 06.表连接优化问题
- 07.Connection连接参数
- 08.Centos7系统参数调优
- 09.mysql监控
- 10.高级SQL语句
- 11.常用维护脚本
- 12.percona-toolkit
- 18.redis高可用方案
- 1.免密登录
- 2.安装部署
- 3.配置文件
- 4.启动脚本
- 19.消息中间件搭建
- 19-01.rabbitmq集群搭建
- 01.rabbitmq01
- 02.rabbitmq02
- 03.rabbitmq03
- 04.镜像队列
- 05.haproxy搭建
- 06.keepalived
- 19-02.rocketmq搭建
- 19-03.kafka集群
- 20.mysql高可用方案
- 1.环境
- 2.mysql部署
- 3.Xtrabackup部署
- 4.Galera部署
- 5.galera for mysql 集群
- 6.haproxy+keepalived部署
- 21.es集群部署
- 22.生产实施优化
- 1.linux优化
- 2.jvm优化
- 3.feign优化
- 4.zuul性能优化
- 23.线上问题诊断
- 01.CPU性能评估工具
- 02.内存性能评估工具
- 03.IO性能评估工具
- 04.网络问题工具
- 05.综合诊断评估工具
- 06.案例诊断01
- 07.案例诊断02
- 08.案例诊断03
- 09.案例诊断04
- 10.远程debug
- 24.fiddler抓包实战
- 01.fiddler介绍
- 02.web端抓包
- 03.app抓包
- 25.疑难解答交流
- 01.有了auth/token获取token了为啥还要配置security的登录配置
- 02.权限数据存放在redis吗,代码在哪里啊
- 03.其他微服务和认证中心的关系
- 04.改包问题
- 05.use RequestContextListener or RequestContextFilter to expose the current request
- 06./oauth/token对应代码在哪里
- 07.验证码出不来
- 08./user/login
- 09.oauth无法自定义权限表达式
- 10.sleuth引发线程数过高问题
- 11.elk中使用7x版本问题
- 12.RedisCommandTimeoutException问题
- 13./oauth/token CPU过高
- 14.feign与权限标识符问题
- 15.动态路由RedisCommandInterruptedException: Command interrupted
- 26.学习资料
- 海量学习资料等你来拿
- 27.持续集成
- 01.git安装
- 02.代码仓库gitlab
- 03.代码仓库gogs
- 04.jdk&&maven
- 05.nexus安装
- 06.sonarqube
- 07.jenkins
- 28.Rancher部署
- 1.rancher-agent部署
- 2.rancher-server部署
- 3.ocp后端部署
- 4.演示前端部署
- 5.elk部署
- 6.docker私服搭建
- 7.rancher-server私服
- 8.rancher-agent docker私服
- 29.K8S部署OCP
- 01.准备OCP的构建环境和部署环境
- 02.部署顺序
- 03.在K8S上部署eureka-server
- 04.在K8S上部署mysql
- 05.在K8S上部署redis
- 06.在K8S上部署auth-server
- 07.在K8S上部署user-center
- 08.在K8S上部署api-gateway
- 09.在K8S上部署back-center
- 30.Spring Cloud Alibaba
- 01.统一的依赖管理
- 02.nacos-server
- 03.生产可用的Nacos集群
- 04.nacos配置中心
- 05.common.yaml
- 06.user-center
- 07.auth-server
- 08.api-gateway
- 09.log-center
- 10.file-center
- 11.back-center
- 12.sentinel-dashboard
- 12.01.sentinel流控规则
- 12.02.sentinel熔断降级规则
- 12.03.sentinel热点规则
- 12.04.sentinel系统规则
- 12.05.sentinel规则持久化
- 12.06.sentinel总结
- 13.sentinel整合openfeign
- 14.sentinel整合网关
- 1.sentinel整合zuul
- 2.sentinel整合scg
- 15.Dubbo与Nacos共存
- 31.Java源码剖析
- 01.基础数据类型和String
- 02.Arrays工具类
- 03.ArrayList源码分析
- 32.面试专题汇总
- 01.JVM专题汇总
- 02.多线程专题汇总
- 03.Spring专题汇总
- 04.springboot专题汇总
- 05.springcloud面试汇总
- 文档问题跟踪处理