# 基于机器学习算法的室内运动时间序列分类
> 原文: [https://machinelearningmastery.com/indoor-movement-time-series-classification-with-machine-learning-algorithms/](https://machinelearningmastery.com/indoor-movement-time-series-classification-with-machine-learning-algorithms/)
室内运动预测涉及使用无线传感器强度数据来预测建筑物内的对象的位置和运动。
这是一个具有挑战性的问题,因为没有直接的分析模型将来自多个传感器的信号强度数据的可变长度轨迹转换为用户行为。
'_ 室内用户移动 _'数据集是标准且免费提供的时间序列分类问题。
在本教程中,您将发现室内运动预测时间序列分类问题以及如何设计功能并评估问题的机器学习算法。
完成本教程后,您将了解:
* 基于传感器强度预测房间运动的时间序列分类问题。
* 如何调查数据以便更好地理解问题以及如何从原始数据中设计特征以进行预测建模。
* 如何检查一套分类算法并调整一种算法以进一步提高问题的表现。
让我们开始吧。
* **更新 Sept / 2018** :添加了指向数据集镜像的链接。

室内运动时间序列分类与机器学习算法
照片由 [Nola Tularosa](https://www.flickr.com/photos/nolatularosa/3238977118/) ,保留一些权利。
## 教程概述
本教程分为五个部分;他们是:
1. 室内用户运动预测
2. 室内运动预测数据集
3. 模型评估
4. 数据准备
5. 算法抽查
## 室内用户运动预测
“_ 室内用户移动 _”预测问题涉及基于由环境中的无线检测器测量的信号强度的变化来确定个体是否已经在房间之间移动。
收集数据集并由 Davide Bacciu 等人提供。来自意大利比萨大学的 2011 年论文“[通过油藏计算](https://pdfs.semanticscholar.org/40c2/393e1874c3fd961fdfff02402c24ccf1c3d7.pdf#page=13)预测异构室内环境中的用户运动”作为探索一种类似于反复神经网络称为“油藏计算”的方法论的数据集。 “
问题是预测室内用户定位和运动模式的更普遍问题的特殊情况。
通过在环境中定位四个无线传感器并在主题上定位一个来收集数据。当四个无线传感器检测到并记录传感器强度的时间序列时,受试者穿过环境。
结果是由可变长度时间序列组成的数据集,其中四个变量描述通过明确定义的静态环境的轨迹,以及运动是否导致环境中的主题更衣室的分类。
这是一个具有挑战性的问题,因为没有明显和通用的方法将信号强度数据与环境中的主题位置相关联。
> RSS 与被跟踪对象的位置之间的关系不能容易地形成分析模型,因为它强烈依赖于环境的特征以及所涉及的无线设备。一世
- [通过油藏计算预测异构室内环境中的用户移动](https://pdfs.semanticscholar.org/40c2/393e1874c3fd961fdfff02402c24ccf1c3d7.pdf#page=13),2011。
在受控的实验条件下收集数据。
传感器被放置在三对两个连接的房间中,其中包含典型的办公家具。两个传感器放置在两个房间的每个房间的角落中,并且受试者走过房间中的六条预定路径中的一条。预测是在每条路径的某个点上进行的,这可能会也可能不会导致房间的变化。
下面的动画片清楚地表明了传感器位置(A1-A4),可能行走的六条可能路径,以及将进行预测的两个点(M)。
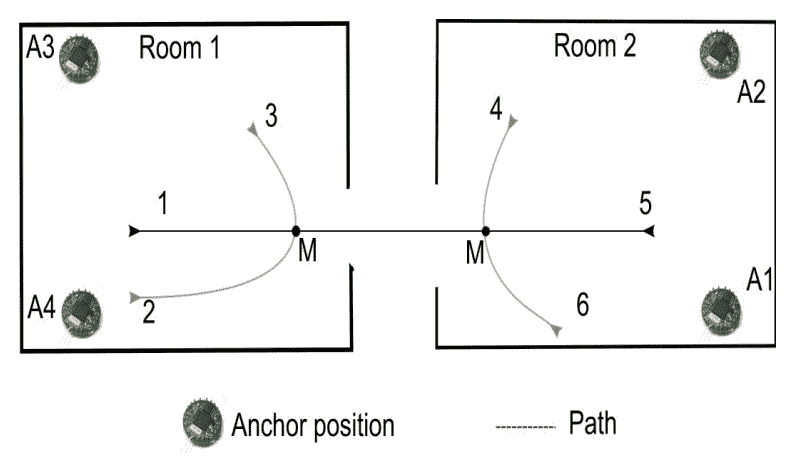
两个房间概述,传感器位置和 6 个预定义路径。
取自“通过油藏计算预测异构室内环境中的用户移动”。
从三对两个房间收集三个数据集,其中走路径并进行传感器测量,称为数据集 1,数据集 2 和数据集 3。
下表摘自论文,总结了三个数据集中每个数据集中走的路径数,房间更改总数和非房间更改(类标签)以及时间序列输入的长度。
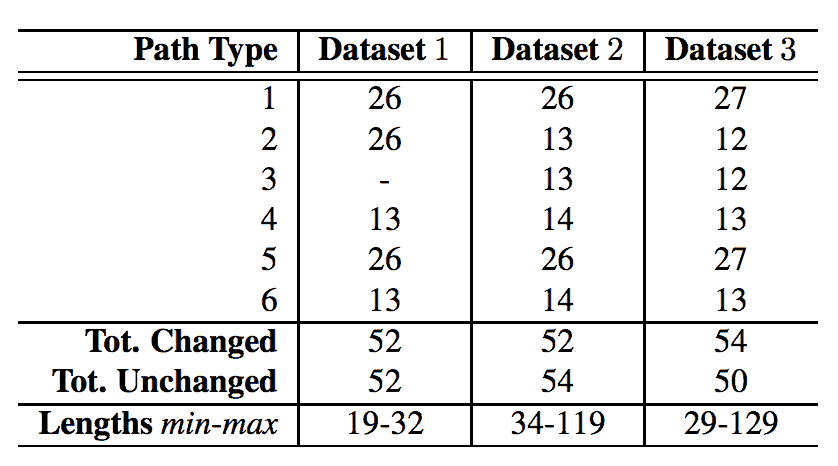
从三对两个房间收集的传感器数据摘要。
取自“通过油藏计算预测异构室内环境中的用户移动”。
从技术上讲,数据由多变量时间序列输入和分类输出组成,可以描述为时间序列分类问题。
> 来自四个锚的 RSS 值被组织成对应于从起始点到标记 M 的轨迹测量的不同长度的序列。目标分类标签与每个输入序列相关联以指示用户是否将要改变其位置(房间)或不。
- [通过油藏计算预测异构室内环境中的用户移动](https://pdfs.semanticscholar.org/40c2/393e1874c3fd961fdfff02402c24ccf1c3d7.pdf#page=13),2011。
## 室内运动预测数据集
数据集可从 UCI 机器学习库免费获得:
* [来自 RSS 数据集的室内用户移动预测,UCI 机器学习库](https://archive.ics.uci.edu/ml/datasets/Indoor+User+Movement+Prediction+from+RSS+data)
如果上述网站出现故障(可能发生),这里是指向数据集镜像的直接链接:
* [IndoorMovement.zip](https://raw.githubusercontent.com/jbrownlee/Datasets/master/IndoorMovement.zip)
数据可以下载为包含以下显着文件的.zip 文件:
* **dataset / MovementAAL_RSS _ ???。csv** 每个动作的 RSS 曲线,文件名中的'???'标记从 1 到 311 的曲目编号。
* **dataset / MovementAAL_target.csv** 跟踪号到输出类值或目标的映射。
* **groups / MovementAAL_DatasetGroup.csv** 跟踪编号到数据集组 1,2 或 3 的映射,标记记录跟踪的一对房间。
* **groups / MovementAAL_Paths.csv** 跟踪号码到路径类型 1-6 的映射,在上面的卡通图中标记。
提供的数据已经标准化。
具体来说,每个输入变量被标准化为每个数据集(一对房间)的范围[-1,1],输出类变量标记为-1 表示房间之间没有过渡,而+1 表示通过房间过渡。
> [...]放置数据包括 4 维 RSS 测量的时间序列(NU = 4),对应于每个数据集独立地在[-1,1]范围内归一化的 4 个锚点[...]
- [通过油藏计算预测异构室内环境中的用户移动](https://pdfs.semanticscholar.org/40c2/393e1874c3fd961fdfff02402c24ccf1c3d7.pdf#page=13),2011。
如果预标准化分布差异很大,则在跨数据集组合观察时,按数据集缩放数据可能(或可能不)引入额外的挑战。
给定跟踪文件中的一个跟踪的时间序列按时间顺序提供,其中一行记录单个时间步的观察结果。数据以 8Hz 记录,这意味着数据中的八个时间步长经过了一秒的时钟时间。
下面是一个跟踪示例,取自' _dataset / MovementAAL_RSS_1.csv_ ',其输出目标为'1'(发生房间转换),来自第 1 组(第一对房间)和是路径 1(房间之间从左到右的直射)。
```py
#RSS_anchor1, RSS_anchor2, RSS_anchor3, RSS_anchor4
-0.90476,-0.48,0.28571,0.3
-0.57143,-0.32,0.14286,0.3
-0.38095,-0.28,-0.14286,0.35
-0.28571,-0.2,-0.47619,0.35
-0.14286,-0.2,0.14286,-0.2
-0.14286,-0.2,0.047619,0
-0.14286,-0.16,-0.38095,0.2
-0.14286,-0.04,-0.61905,-0.2
-0.095238,-0.08,0.14286,-0.55
-0.047619,0.04,-0.095238,0.05
-0.19048,-0.04,0.095238,0.4
-0.095238,-0.04,-0.14286,0.35
-0.33333,-0.08,-0.28571,-0.2
-0.2381,0.04,0.14286,0.35
0,0.08,0.14286,0.05
-0.095238,0.04,0.095238,0.1
-0.14286,-0.2,0.14286,0.5
-0.19048,0.04,-0.42857,0.3
-0.14286,-0.08,-0.2381,0.15
-0.33333,0.16,-0.14286,-0.8
-0.42857,0.16,-0.28571,-0.1
-0.71429,0.16,-0.28571,0.2
-0.095238,-0.08,0.095238,0.35
-0.28571,0.04,0.14286,0.2
0,0.04,0.14286,0.1
0,0.04,-0.047619,-0.05
-0.14286,-0.6,-0.28571,-0.1
```
如第一篇论文所述,数据集以两种特定方式(实验设置或 ES)使用,以评估问题的预测模型,指定为 ES1 和 ES2。
* **ES1** :合并数据集 1 和 2,将其分为训练(80%)和测试(20%)集以评估模型。
* **ES2** :合并用作训练集的数据集 1 和 2(66%),数据集 3 用作测试集(34%)以评估模型。
ES1 案例评估模型以概括两对已知房间内的移动,即具有已知几何形状的房间。 ES2 案例试图推广从两个房间到第三个看不见的房间的运动:一个更难的问题。
2011 年的论文报告了 ES1 上大约 95%的分类准确率和 ES2 大约 89%的表现,经过对一套算法的一些测试后,我非常令人印象深刻。
## 加载和探索数据集
在本节中,我们将数据加载到内存中并使用摘要和可视化进行探索,以帮助更好地了解问题的建模方式。
首先,下载数据集并将下载的存档解压缩到当前工作目录中。
### 加载数据集
目标,组和路径文件可以直接作为 Pandas DataFrames 加载。
```py
# load mapping files
from pandas import read_csv
target_mapping = read_csv('dataset/MovementAAL_target.csv', header=0)
group_mapping = read_csv('groups/MovementAAL_DatasetGroup.csv', header=0)
paths_mapping = read_csv('groups/MovementAAL_Paths.csv', header=0)
```
信号强度曲线存储在 _ 数据集/_ 目录中的单独文件中。
这些可以通过迭代目录中的所有文件并直接加载序列来加载。因为每个序列都有一个可变长度(可变行数),我们可以为列表中的每个跟踪存储 NumPy 数组。
```py
# load sequences and targets into memory
from pandas import read_csv
from os import listdir
sequences = list()
directory = 'dataset'
target_mapping = None
for name in listdir(directory):
filename = directory + '/' + name
if filename.endswith('_target.csv'):
continue
df = read_csv(filename, header=0)
values = df.values
sequences.append(values)
```
我们可以将所有这些绑定到一个名为 _load_dataset()_ 的函数中,并将数据加载到内存中。
下面列出了完整的示例。
```py
# load user movement dataset into memory
from pandas import read_csv
from os import listdir
# return list of traces, and arrays for targets, groups and paths
def load_dataset(prefix=''):
grps_dir, data_dir = prefix+'groups/', prefix+'dataset/'
# load mapping files
targets = read_csv(data_dir + 'MovementAAL_target.csv', header=0)
groups = read_csv(grps_dir + 'MovementAAL_DatasetGroup.csv', header=0)
paths = read_csv(grps_dir + 'MovementAAL_Paths.csv', header=0)
# load traces
sequences = list()
target_mapping = None
for name in listdir(data_dir):
filename = data_dir + name
if filename.endswith('_target.csv'):
continue
df = read_csv(filename, header=0)
values = df.values
sequences.append(values)
return sequences, targets.values[:,1], groups.values[:,1], paths.values[:,1]
# load dataset
sequences, targets, groups, paths = load_dataset()
# summarize shape of the loaded data
print(len(sequences), targets.shape, groups.shape, paths.shape)
```
运行该示例加载数据并显示已从磁盘正确加载 314 条跟踪及其相关输出(目标为-1 或+1),数据集编号(组为 1,2 或 3)和路径编号(路径为 1) -6)。
```py
314 (314,) (314,) (314,)
```
### 基本信息
我们现在可以仔细查看加载的数据,以更好地理解或确认我们对问题的理解。
我们从论文中了解到,数据集在两个类别方面是合理平衡的。我们可以通过总结所有观察的类别细分来证实这一点。
```py
# summarize class breakdown
class1,class2 = len(targets[targets==-1]), len(targets[targets==1])
print('Class=-1: %d %.3f%%' % (class1, class1/len(targets)*100))
print('Class=+1: %d %.3f%%' % (class2, class2/len(targets)*100))
```
接下来,我们可以通过绘制原始值的直方图来查看四个锚点中每一个的传感器强度值的分布。
这要求我们创建一个包含所有观察行的数组,以便我们可以绘制每列的分布。 _vstack()_ NumPy 函数将为我们完成这项工作。
```py
# histogram for each anchor point
all_rows = vstack(sequences)
pyplot.figure()
variables = [0, 1, 2, 3]
for v in variables:
pyplot.subplot(len(variables), 1, v+1)
pyplot.hist(all_rows[:, v], bins=20)
pyplot.show()
```
最后,另一个有趣的方面是跟踪长度的分布。
我们可以使用直方图来总结这种分布。
```py
# histogram for trace lengths
trace_lengths = [len(x) for x in sequences]
pyplot.hist(trace_lengths, bins=50)
pyplot.show()
```
综合这些,下面列出了加载和汇总数据的完整示例。
```py
# summarize simple information about user movement data
from os import listdir
from numpy import array
from numpy import vstack
from pandas import read_csv
from matplotlib import pyplot
# return list of traces, and arrays for targets, groups and paths
def load_dataset(prefix=''):
grps_dir, data_dir = prefix+'groups/', prefix+'dataset/'
# load mapping files
targets = read_csv(data_dir + 'MovementAAL_target.csv', header=0)
groups = read_csv(grps_dir + 'MovementAAL_DatasetGroup.csv', header=0)
paths = read_csv(grps_dir + 'MovementAAL_Paths.csv', header=0)
# load traces
sequences = list()
target_mapping = None
for name in listdir(data_dir):
filename = data_dir + name
if filename.endswith('_target.csv'):
continue
df = read_csv(filename, header=0)
values = df.values
sequences.append(values)
return sequences, targets.values[:,1], groups.values[:,1], paths.values[:,1]
# load dataset
sequences, targets, groups, paths = load_dataset()
# summarize class breakdown
class1,class2 = len(targets[targets==-1]), len(targets[targets==1])
print('Class=-1: %d %.3f%%' % (class1, class1/len(targets)*100))
print('Class=+1: %d %.3f%%' % (class2, class2/len(targets)*100))
# histogram for each anchor point
all_rows = vstack(sequences)
pyplot.figure()
variables = [0, 1, 2, 3]
for v in variables:
pyplot.subplot(len(variables), 1, v+1)
pyplot.hist(all_rows[:, v], bins=20)
pyplot.show()
# histogram for trace lengths
trace_lengths = [len(x) for x in sequences]
pyplot.hist(trace_lengths, bins=50)
pyplot.show()
```
首先运行该示例总结了观察的类分布。
结果证实了我们对完整数据集的期望在两个阶段结果的观察方面几乎完全平衡。
```py
Class=-1: 156 49.682%
Class=+1: 158 50.318%
```
接下来,创建每个锚点的传感器强度的直方图,总结数据分布。
我们可以看到每个变量的分布接近正常,显示出类似高斯的形状。我们也可以看到围绕-1 的观测数据太多。这可能表示可以标记甚至从序列中过滤掉的通用“无强度”观察结果。
调查分布是否按路径类型甚至数据集编号更改可能会很有趣。
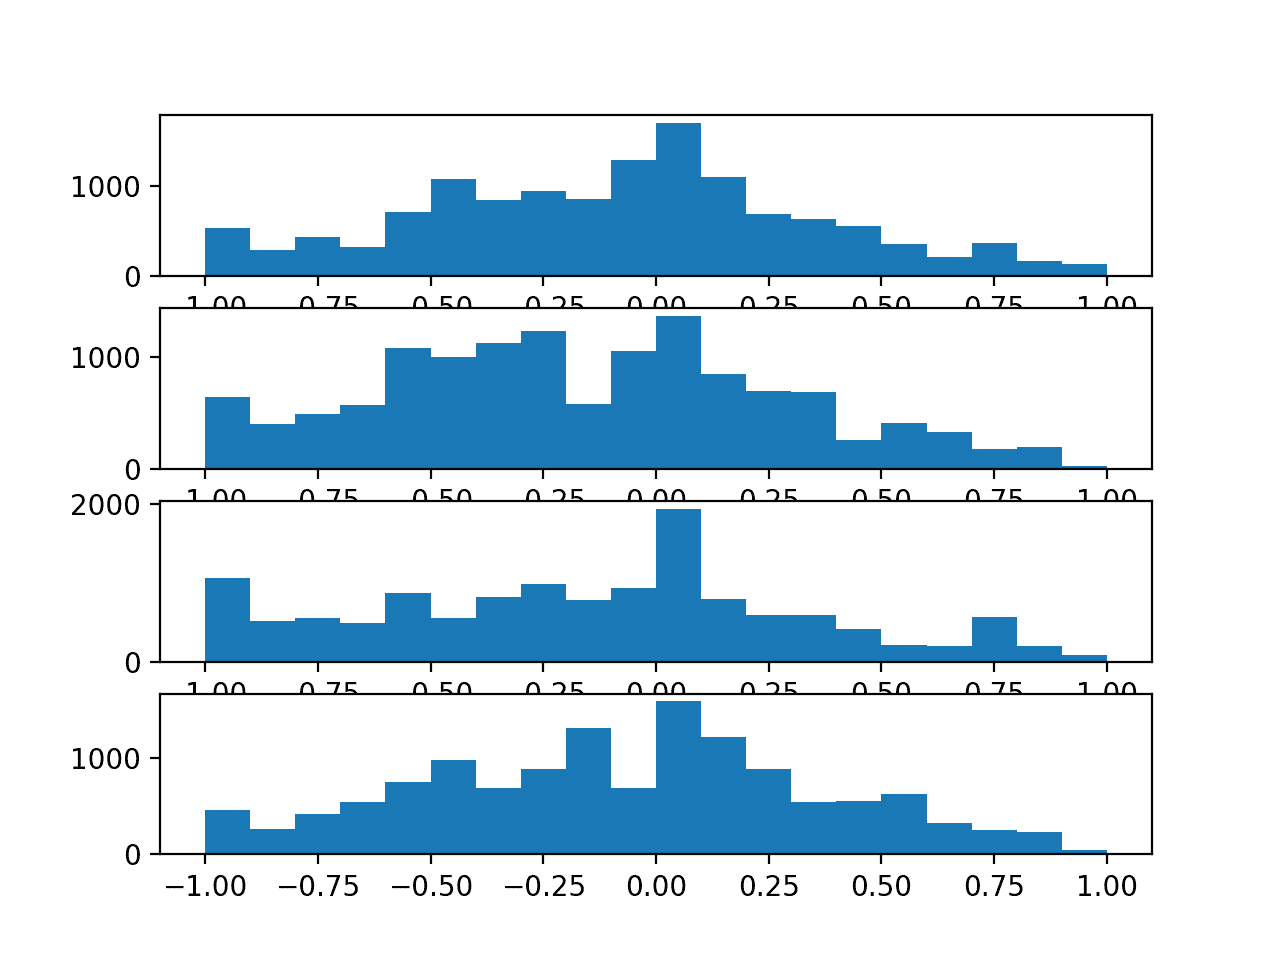
每个锚点的传感器强度值的直方图
最后,创建序列长度的直方图。
我们可以看到长度在 25,40 和 60 之间的序列簇。我们还可以看到,如果我们想要修剪长序列,那么最长约 70 个时间步长可能是合适的。最小长度似乎是 19。
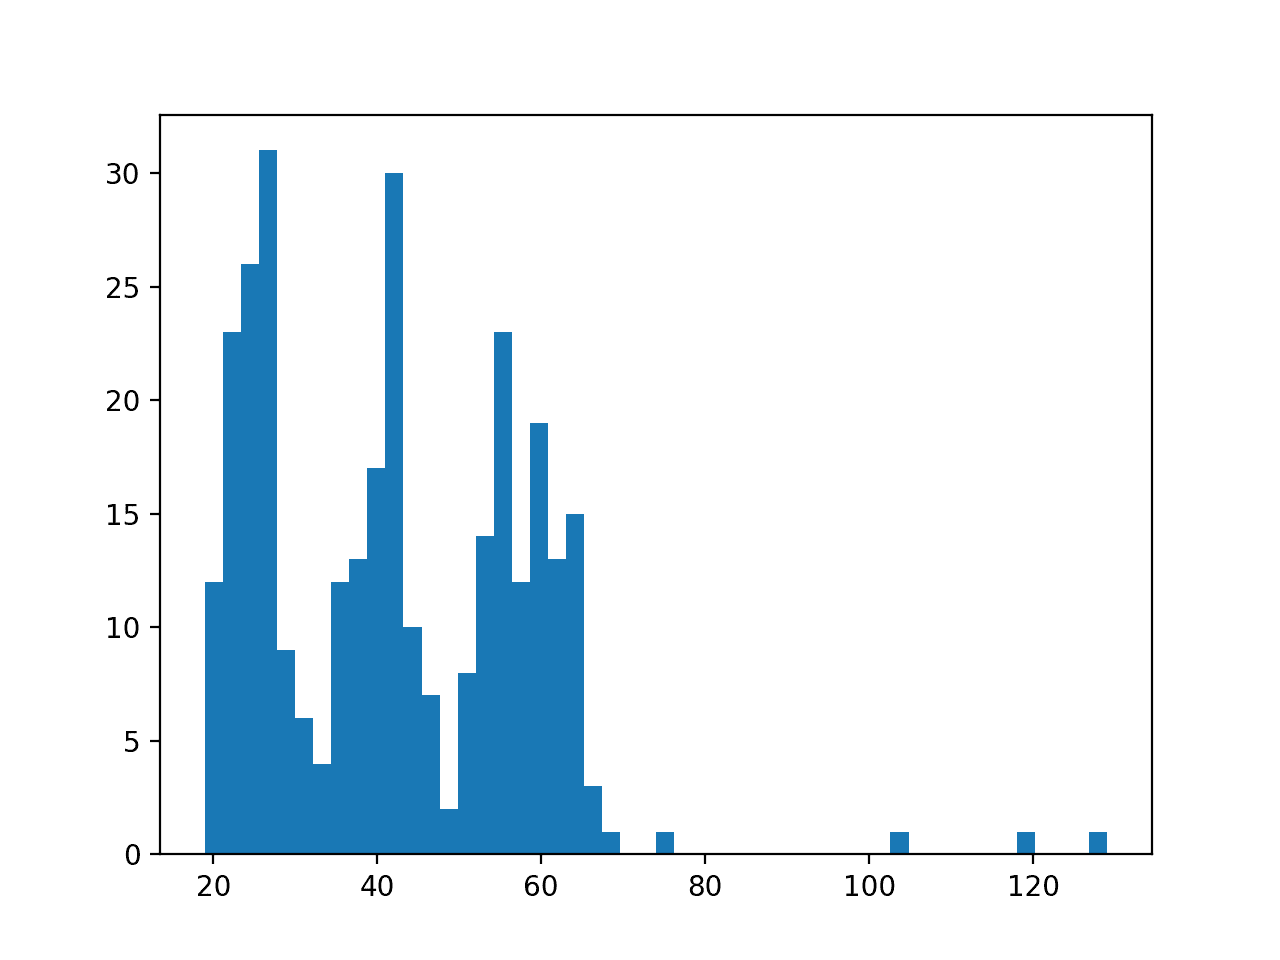
传感器强度序列长度的直方图
### 时间序列图
我们正在处理时间序列数据,因此我们实际查看序列的一些示例非常重要。
我们可以按路径对轨迹进行分组,并为每条路径绘制一条轨迹的示例。期望不同路径的迹线在某些方面可能看起来不同。
```py
# group sequences by paths
paths = [1,2,3,4,5,6]
seq_paths = dict()
for path in paths:
seq_paths[path] = [sequences[j] for j in range(len(paths)) if paths[j]==path]
# plot one example of a trace for each path
pyplot.figure()
for i in paths:
pyplot.subplot(len(paths), 1, i)
# line plot each variable
for j in [0, 1, 2, 3]:
pyplot.plot(seq_paths[i][0][:, j], label='Anchor ' + str(j+1))
pyplot.title('Path ' + str(i), y=0, loc='left')
pyplot.show()
```
我们还可以绘制一个迹线的每个系列以及线性回归模型预测的趋势。这将使该系列中的任何趋势变得明显。
我们可以使用 [lstsq()NumPy 函数](https://docs.scipy.org/doc/numpy/reference/generated/numpy.linalg.lstsq.html)对给定系列拟合线性回归。
下面的函数 _regress()_ 将一系列作为单个变量,通过最小二乘拟合线性回归模型,并预测每个时间步的输出返回捕获数据趋势的序列。
```py
# fit a linear regression function and return the predicted values for the series
def regress(y):
# define input as the time step
X = array([i for i in range(len(y))]).reshape(len(y), 1)
# fit linear regression via least squares
b = lstsq(X, y)[0][0]
# predict trend on time step
yhat = b * X[:,0]
return yhat
```
我们可以使用该函数绘制单个迹线中每个变量的时间序列的趋势。
```py
# plot series for a single trace with trend
seq = sequences[0]
variables = [0, 1, 2, 3]
pyplot.figure()
for i in variables:
pyplot.subplot(len(variables), 1, i+1)
# plot the series
pyplot.plot(seq[:,i])
# plot the trend
pyplot.plot(regress(seq[:,i]))
pyplot.show()
```
将所有这些结合在一起,下面列出了完整的示例。
```py
# plot series data
from os import listdir
from numpy import array
from numpy import vstack
from numpy.linalg import lstsq
from pandas import read_csv
from matplotlib import pyplot
# return list of traces, and arrays for targets, groups and paths
def load_dataset(prefix=''):
grps_dir, data_dir = prefix+'groups/', prefix+'dataset/'
# load mapping files
targets = read_csv(data_dir + 'MovementAAL_target.csv', header=0)
groups = read_csv(grps_dir + 'MovementAAL_DatasetGroup.csv', header=0)
paths = read_csv(grps_dir + 'MovementAAL_Paths.csv', header=0)
# load traces
sequences = list()
target_mapping = None
for name in listdir(data_dir):
filename = data_dir + name
if filename.endswith('_target.csv'):
continue
df = read_csv(filename, header=0)
values = df.values
sequences.append(values)
return sequences, targets.values[:,1], groups.values[:,1], paths.values[:,1]
# fit a linear regression function and return the predicted values for the series
def regress(y):
# define input as the time step
X = array([i for i in range(len(y))]).reshape(len(y), 1)
# fit linear regression via least squares
b = lstsq(X, y)[0][0]
# predict trend on time step
yhat = b * X[:,0]
return yhat
# load dataset
sequences, targets, groups, paths = load_dataset()
# group sequences by paths
paths = [1,2,3,4,5,6]
seq_paths = dict()
for path in paths:
seq_paths[path] = [sequences[j] for j in range(len(paths)) if paths[j]==path]
# plot one example of a trace for each path
pyplot.figure()
for i in paths:
pyplot.subplot(len(paths), 1, i)
# line plot each variable
for j in [0, 1, 2, 3]:
pyplot.plot(seq_paths[i][0][:, j], label='Anchor ' + str(j+1))
pyplot.title('Path ' + str(i), y=0, loc='left')
pyplot.show()
# plot series for a single trace with trend
seq = sequences[0]
variables = [0, 1, 2, 3]
pyplot.figure()
for i in variables:
pyplot.subplot(len(variables), 1, i+1)
# plot the series
pyplot.plot(seq[:,i])
# plot the trend
pyplot.plot(regress(seq[:,i]))
pyplot.show()
```
运行该示例将创建一个包含六个图形的图表,每个图形对应六个路径中的每一个。给定的图显示了单个迹线的线图,其中包含迹线的四个变量,每个锚点一个。
也许所选择的迹线代表每条路径,也许不是。
我们可以看到一些明显的差异:
* **随时间变化的变量分组**。成对变量可以组合在一起,或者所有变量可以在给定时间组合在一起。
* **随时间变化的趋势**。变量聚集在一起向中间或分散到极端。
理想情况下,如果行为的这些变化是预测性的,则预测模型必须提取这些特征,或者将这些特征的摘要作为输入呈现。
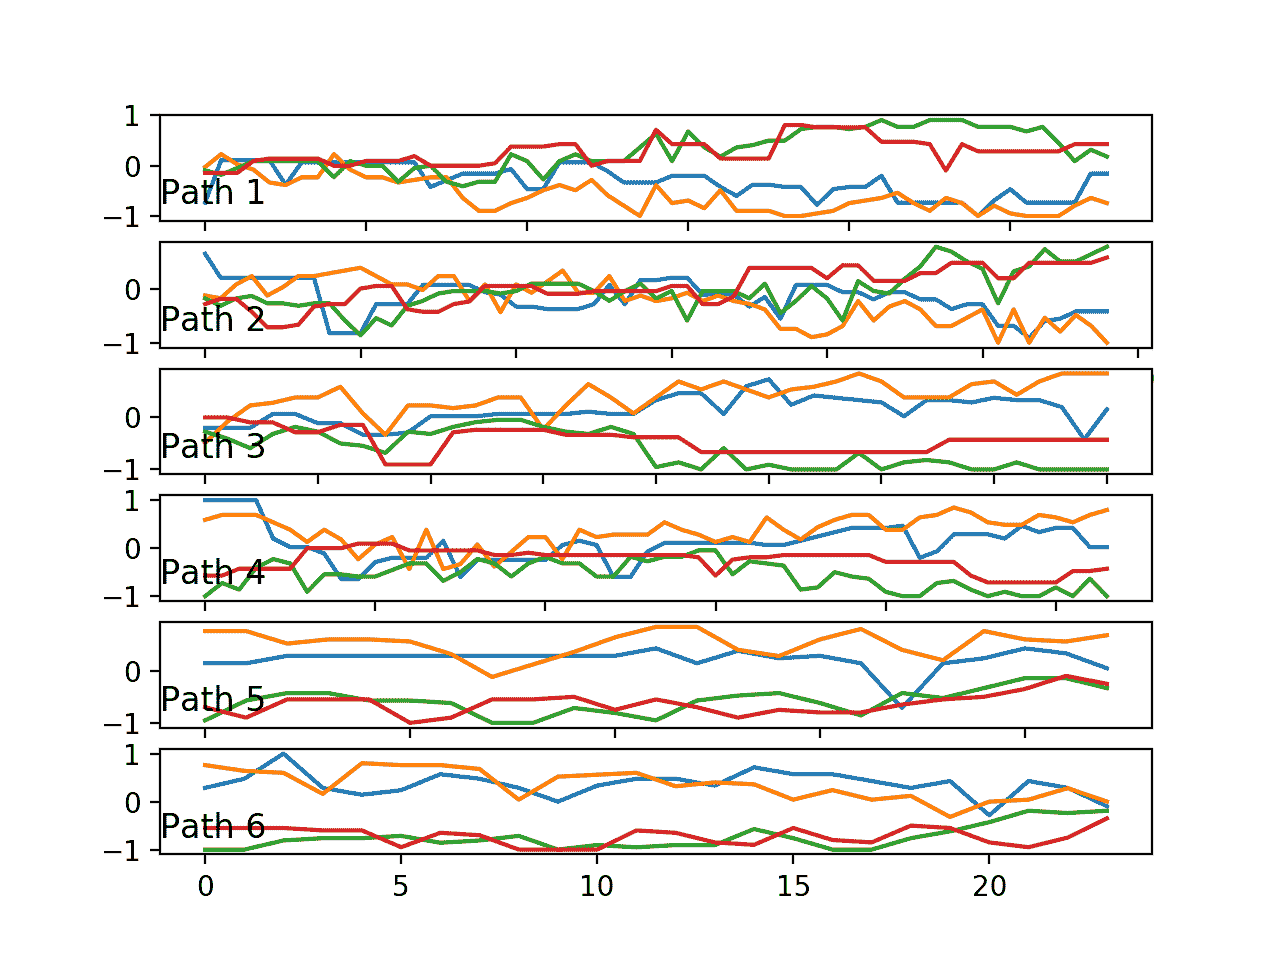
六条路径中每条路径的一条迹线(4 个变量)的线图。
创建第二个图,显示单个迹线中四个系列的线图以及趋势线。
我们可以看到,至少对于这种迹线,当用户在环境中移动时,传感器强度数据有明显的趋势。这可能表明有机会在建模之前使数据静止或使用迹线中的每个系列的趋势(观察或系数)作为预测模型的输入。

具有趋势线的单个迹线中的时间序列的线图
## 模型评估
有许多方法可以拟合和评估此数据的模型。
鉴于类的平衡,分类准确性似乎是一个良好的首先评估指标。通过预测概率和探索 ROC 曲线上的阈值,可以在将来寻求更多的细微差别。
我看到使用这些数据的两个主要主题:
* **同房**:一个房间里的痕迹训练的模型可以预测那个房间里新痕迹的结果吗?
* **不同的房间**:一个或两个房间的痕迹训练模型可以预测不同房间的新痕迹的结果吗?
本文中描述并总结的 ES1 和 ES2 案例探讨了这些问题,并提供了一个有用的起点。
首先,我们必须将加载的跟踪和目标分成三组。
```py
# separate traces
seq1 = [sequences[i] for i in range(len(groups)) if groups[i]==1]
seq2 = [sequences[i] for i in range(len(groups)) if groups[i]==2]
seq3 = [sequences[i] for i in range(len(groups)) if groups[i]==3]
print(len(seq1),len(seq2),len(seq3))
# separate target
targets1 = [targets[i] for i in range(len(groups)) if groups[i]==1]
targets2 = [targets[i] for i in range(len(groups)) if groups[i]==2]
targets3 = [targets[i] for i in range(len(groups)) if groups[i]==3]
print(len(targets1),len(targets2),len(targets3))
```
在 ES1 的情况下,我们可以使用 k 折交叉验证,其中 k = 5,使用与论文相同的比率,并且重复评估为评估提供了一些稳健性。
我们可以使用 scikit-learn 中的 [cross_val_score()函数](http://scikit-learn.org/stable/modules/generated/sklearn.model_selection.cross_val_score.html)来评估模型,然后计算得分的均值和标准差。
```py
# evaluate model for ES1
from numpy import mean
from numpy import std
from sklearn.model_selection import cross_val_score
...
scores = cross_val_score(model, X, y, scoring='accuracy', cv=5, n_jobs=-1)
m, s = mean(scores), std(scores)
```
在 ES2 的情况下,我们可以将模型拟合到数据集 1 和 2 上,并直接测试数据集 3 上的模型技能。
## 数据准备
输入数据如何为预测问题构建灵活性。
我想到了两种方法:
* **自动特征学习**。深度神经网络能够自动进行特征学习,而循环神经网络可以直接支持多变量多步输入数据。可以使用循环神经网络,例如 LSTM 或 1D CNN。可以将序列填充为相同的长度,例如 70 个时间步长,并且可以使用掩蔽层来忽略填充的时间步长。
* **特色工程**。或者,可变长度序列可以概括为单个固定长度向量,并提供给标准机器学习模型用于预测。这需要仔细的特征工程,以便为模型提供足够的跟踪描述,以学习到输出类的映射。
两者都是有趣的方法。
作为第一步,我们将通过手动特征工程准备更传统的固定长度向量输入。
以下是有关可以包含在向量中的功能的一些想法:
* 变量的第一个,中间或最后 n 个观测值。
* 变量的第一个,中间或最后 n 个观测值的平均值或标准差。
* 最后和第 n 个观察结果之间的差异
* 对变量的第一,中或最后 n 个观察值的差异。
* 变量的所有,第一,中间或最后 n 个观测值的线性回归系数。
* 线性回归预测变量的第一,中间或最后 n 个观测值的趋势。
此外,原始值可能不需要数据缩放,因为数据已经缩放到-1 到 1 的范围。如果添加了不同单位的新功能,则可能需要缩放。
一些变量确实显示出一些趋势,这表明可能差异变量可能有助于梳理信号。
每个变量的分布接近高斯分布,因此一些算法可能会受益于标准化,甚至可能是 Box-Cox 变换。
## 算法抽查
在本节中,我们将对具有不同工程特性集的一套标准机器学习算法的默认配置进行抽查。
现场检查是一种有用的技术,可快速清除输入和输出之间的映射是否有任何信号需要学习,因为大多数测试方法都会提取一些东西。该方法还可以提出可能值得进一步研究的方法。
缺点是每种方法都没有给出它最好的机会(配置)以显示它可以对问题做什么,这意味着任何进一步研究的方法都会受到第一批结果的偏见。
在这些测试中,我们将研究一套六种不同类型的算法,具体来说:
* Logistic 回归。
* k-最近邻居。
* 决策树。
* 支持向量机。
* 随机森林。
* 梯度增压机。
我们将在关注时间序列变量末尾的特征上测试这些方法的默认配置,因为它们可能最能预测房间转换是否会发生。
### 最后 _n_ 观察
最后 _n_ 观察结果可能预示着运动是否会导致房间过渡。
跟踪数据中最小的时间步长为 19,因此,我们将使用 _n = 19_ 作为起点。
下面名为 _create_dataset()_ 的函数将使用平面一维向量中每条迹线的最后 _n_ 观测值创建一个固定长度向量,然后将目标添加为最后一个元素向量。
简单的机器学习算法需要对跟踪数据进行扁平化。
```py
# create a fixed 1d vector for each trace with output variable
def create_dataset(sequences, targets):
# create the transformed dataset
transformed = list()
n_vars = 4
n_steps = 19
# process each trace in turn
for i in range(len(sequences)):
seq = sequences[i]
vector = list()
# last n observations
for row in range(1, n_steps+1):
for col in range(n_vars):
vector.append(seq[-row, col])
# add output
vector.append(targets[i])
# store
transformed.append(vector)
# prepare array
transformed = array(transformed)
transformed = transformed.astype('float32')
return transformed
```
我们可以像以前一样加载数据集,并将其分类到数据集 1,2 和 3 中,如“_ 模型评估 _”部分所述。
然后我们可以调用 _create_dataset()_ 函数来创建 ES1 和 ES2 案例所需的数据集,特别是 ES1 组合数据集 1 和 2,而 ES2 使用数据集 1 和 2 作为训练集,数据集 3 作为测试集。
下面列出了完整的示例。
```py
# prepare fixed length vector dataset
from os import listdir
from numpy import array
from numpy import savetxt
from pandas import read_csv
# return list of traces, and arrays for targets, groups and paths
def load_dataset(prefix=''):
grps_dir, data_dir = prefix+'groups/', prefix+'dataset/'
# load mapping files
targets = read_csv(data_dir + 'MovementAAL_target.csv', header=0)
groups = read_csv(grps_dir + 'MovementAAL_DatasetGroup.csv', header=0)
paths = read_csv(grps_dir + 'MovementAAL_Paths.csv', header=0)
# load traces
sequences = list()
target_mapping = None
for name in listdir(data_dir):
filename = data_dir + name
if filename.endswith('_target.csv'):
continue
df = read_csv(filename, header=0)
values = df.values
sequences.append(values)
return sequences, targets.values[:,1], groups.values[:,1], paths.values[:,1]
# create a fixed 1d vector for each trace with output variable
def create_dataset(sequences, targets):
# create the transformed dataset
transformed = list()
n_vars = 4
n_steps = 19
# process each trace in turn
for i in range(len(sequences)):
seq = sequences[i]
vector = list()
# last n observations
for row in range(1, n_steps+1):
for col in range(n_vars):
vector.append(seq[-row, col])
# add output
vector.append(targets[i])
# store
transformed.append(vector)
# prepare array
transformed = array(transformed)
transformed = transformed.astype('float32')
return transformed
# load dataset
sequences, targets, groups, paths = load_dataset()
# separate traces
seq1 = [sequences[i] for i in range(len(groups)) if groups[i]==1]
seq2 = [sequences[i] for i in range(len(groups)) if groups[i]==2]
seq3 = [sequences[i] for i in range(len(groups)) if groups[i]==3]
# separate target
targets1 = [targets[i] for i in range(len(groups)) if groups[i]==1]
targets2 = [targets[i] for i in range(len(groups)) if groups[i]==2]
targets3 = [targets[i] for i in range(len(groups)) if groups[i]==3]
# create ES1 dataset
es1 = create_dataset(seq1+seq2, targets1+targets2)
print('ES1: %s' % str(es1.shape))
savetxt('es1.csv', es1, delimiter=',')
# create ES2 dataset
es2_train = create_dataset(seq1+seq2, targets1+targets2)
es2_test = create_dataset(seq3, targets3)
print('ES2 Train: %s' % str(es2_train.shape))
print('ES2 Test: %s' % str(es2_test.shape))
savetxt('es2_train.csv', es2_train, delimiter=',')
savetxt('es2_test.csv', es2_test, delimiter=',')
```
运行该示例创建三个新的 CSV 文件,特别是' _es1.csv_ ',' _es2_train.csv_ '和' _es2_test.csv_ '用于 ES1 和分别为 ES2 病例。
还总结了这些数据集的形状。
```py
ES1: (210, 77)
ES2 Train: (210, 77)
ES2 Test: (104, 77)
```
接下来,我们可以评估 ES1 数据集上的模型。
经过一些测试后,似乎标准化数据集会为那些依赖距离值(KNN 和 SVM)的方法带来更好的模型技能,并且通常对其他方法没有影响。因此,使用管道来评估首先标准化数据集的每个算法。
下面列出了新数据集上的抽样检查算法的完整示例。
```py
# spot check for ES1
from numpy import mean
from numpy import std
from pandas import read_csv
from matplotlib import pyplot
from sklearn.model_selection import cross_val_score
from sklearn.pipeline import Pipeline
from sklearn.preprocessing import StandardScaler
from sklearn.linear_model import LogisticRegression
from sklearn.neighbors import KNeighborsClassifier
from sklearn.tree import DecisionTreeClassifier
from sklearn.svm import SVC
from sklearn.ensemble import RandomForestClassifier
from sklearn.ensemble import GradientBoostingClassifier
# load dataset
dataset = read_csv('es1.csv', header=None)
# split into inputs and outputs
values = dataset.values
X, y = values[:, :-1], values[:, -1]
# create a list of models to evaluate
models, names = list(), list()
# logistic
models.append(LogisticRegression())
names.append('LR')
# knn
models.append(KNeighborsClassifier())
names.append('KNN')
# cart
models.append(DecisionTreeClassifier())
names.append('CART')
# svm
models.append(SVC())
names.append('SVM')
# random forest
models.append(RandomForestClassifier())
names.append('RF')
# gbm
models.append(GradientBoostingClassifier())
names.append('GBM')
# evaluate models
all_scores = list()
for i in range(len(models)):
# create a pipeline for the model
s = StandardScaler()
p = Pipeline(steps=[('s',s), ('m',models[i])])
scores = cross_val_score(p, X, y, scoring='accuracy', cv=5, n_jobs=-1)
all_scores.append(scores)
# summarize
m, s = mean(scores)*100, std(scores)*100
print('%s %.3f%% +/-%.3f' % (names[i], m, s))
# plot
pyplot.boxplot(all_scores, labels=names)
pyplot.show()
```
运行该示例打印每个算法的估计表现,包括超过 5 倍交叉验证的平均值和标准差。
结果表明 SVM 可能值得以 58%的准确度更详细地查看。
```py
LR 55.285% +/-5.518
KNN 50.897% +/-5.310
CART 50.501% +/-10.922
SVM 58.551% +/-7.707
RF 50.442% +/-6.355
GBM 55.749% +/-5.423
```
结果也显示为显示分数分布的盒须图。
同样,SVM 似乎具有良好的平均表现和紧密的方差。
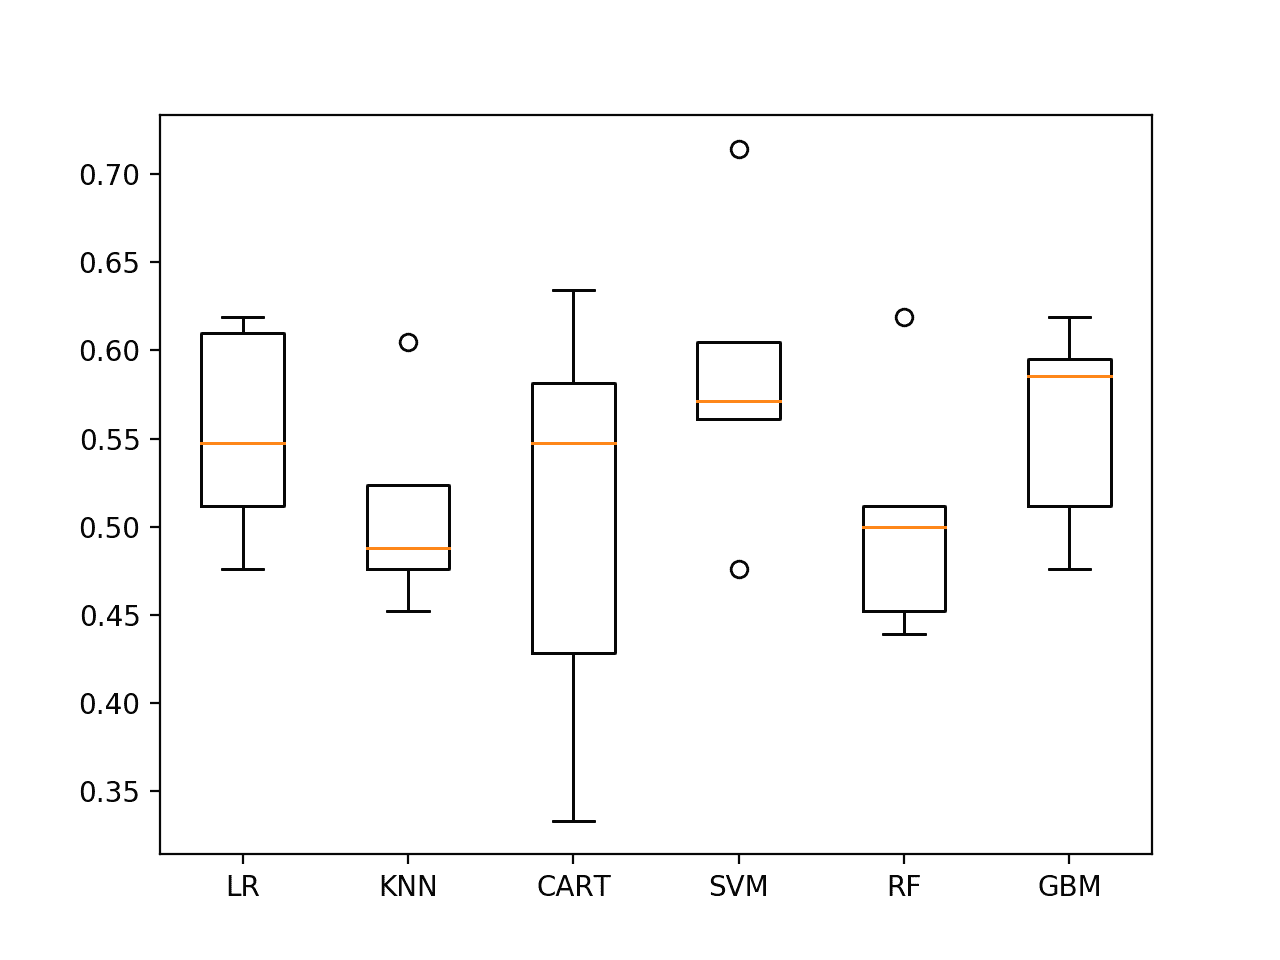
使用最近 19 次观察在 ES1 上进行抽样检查算法
### 最后 _n_ 使用填充进行观察
我们可以将每条迹线填充到固定长度。
这将提供在每个序列中包括更多先前 _n_ 观察结果的灵活性。 _n_ 的选择也必须与添加到较短序列的填充值的增加相平衡,这反过来可能对模型在这些序列上的表现产生负面影响。
我们可以通过将 0.0 值添加到每个变量序列的开头来填充每个序列,直到最大长度,例如,达到了 200 个时间步长。我们可以使用 [pad()NumPy 函数](https://docs.scipy.org/doc/numpy/reference/generated/numpy.pad.html)来完成此操作。
```py
from numpy import pad
...
# pad sequences
max_length = 200
seq = pad(seq, ((max_length-len(seq),0),(0,0)), 'constant', constant_values=(0.0))
```
具有填充支持的 _create_dataset()_ 功能的更新版本如下。
我们将尝试 _n = 25_ 以包括每个载体中每个序列中的 25 个最后观察结果。虽然您可能想要探索其他配置是否会带来更好的技能,但可以通过一些试验和错误找到此值。
```py
# create a fixed 1d vector for each trace with output variable
def create_dataset(sequences, targets):
# create the transformed dataset
transformed = list()
n_vars, n_steps, max_length = 4, 25, 200
# process each trace in turn
for i in range(len(sequences)):
seq = sequences[i]
# pad sequences
seq = pad(seq, ((max_length-len(seq),0),(0,0)), 'constant', constant_values=(0.0))
vector = list()
# last n observations
for row in range(1, n_steps+1):
for col in range(n_vars):
vector.append(seq[-row, col])
# add output
vector.append(targets[i])
# store
transformed.append(vector)
# prepare array
transformed = array(transformed)
transformed = transformed.astype('float32')
return transformed
```
使用新功能再次运行脚本会创建更新的 CSV 文件。
```py
ES1: (210, 101)
ES2 Train: (210, 101)
ES2 Test: (104, 101)
```
同样,重新运行数据上的抽样检查脚本会导致 SVM 模型技能的小幅提升,并且还表明 KNN 可能值得进一步调查。
```py
LR 54.344% +/-6.195
KNN 58.562% +/-4.456
CART 52.837% +/-7.650
SVM 59.515% +/-6.054
RF 50.396% +/-7.069
GBM 50.873% +/-5.416
```
KNN 和 SVM 的箱形图显示出良好的表现和相对紧密的标准偏差。

使用最近 25 次观察对 ES1 上的抽样检查算法
我们可以更新点检查到网格搜索 KNN 算法的一组 k 值,看看是否可以通过一点调整进一步改进模型的技能。
下面列出了完整的示例。
```py
# spot check for ES1
from numpy import mean
from numpy import std
from pandas import read_csv
from matplotlib import pyplot
from sklearn.model_selection import cross_val_score
from sklearn.neighbors import KNeighborsClassifier
from sklearn.pipeline import Pipeline
from sklearn.preprocessing import StandardScaler
# load dataset
dataset = read_csv('es1.csv', header=None)
# split into inputs and outputs
values = dataset.values
X, y = values[:, :-1], values[:, -1]
# try a range of k values
all_scores, names = list(), list()
for k in range(1,22):
# evaluate
scaler = StandardScaler()
model = KNeighborsClassifier(n_neighbors=k)
pipeline = Pipeline(steps=[('s',scaler), ('m',model)])
names.append(str(k))
scores = cross_val_score(pipeline, X, y, scoring='accuracy', cv=5, n_jobs=-1)
all_scores.append(scores)
# summarize
m, s = mean(scores)*100, std(scores)*100
print('k=%d %.3f%% +/-%.3f' % (k, m, s))
# plot
pyplot.boxplot(all_scores, labels=names)
pyplot.show()
```
运行该示例打印精度的均值和标准差,k 值从 1 到 21。
我们可以看到 _k = 7_ 导致最佳技能为 62.872%。
```py
k=1 49.534% +/-4.407
k=2 49.489% +/-4.201
k=3 56.599% +/-6.923
k=4 55.660% +/-6.600
k=5 58.562% +/-4.456
k=6 59.991% +/-7.901
k=7 62.872% +/-8.261
k=8 59.538% +/-5.528
k=9 57.633% +/-4.723
k=10 59.074% +/-7.164
k=11 58.097% +/-7.583
k=12 58.097% +/-5.294
k=13 57.179% +/-5.101
k=14 57.644% +/-3.175
k=15 59.572% +/-5.481
k=16 59.038% +/-1.881
k=17 59.027% +/-2.981
k=18 60.490% +/-3.368
k=19 60.014% +/-2.497
k=20 58.562% +/-2.018
k=21 58.131% +/-3.084
```
_k_ 值的准确度得分的框和胡须图显示, _k_ 值约为 7,例如 5 和 6,也在数据集上产生稳定且表现良好的模型。

通过最后 25 次观察,对 ES1 上的 KNN 邻居进行抽查
### 在 ES2 上评估 KNN
现在我们已经了解了一个表示( _n = 25_ )和一个模型(KNN, _k = 7_ ),它们具有一定的随机预测技能,我们可以测试该方法在更难的 ES2 数据集上。
每个模型都在数据集 1 和 2 的组合上进行训练,然后在数据集 3 上进行评估。不使用 k 折交叉验证程序,因此我们希望得分是有噪声的。
下面列出了 ES2 算法的完整抽样检查。
```py
# spot check for ES2
from pandas import read_csv
from matplotlib import pyplot
from sklearn.metrics import accuracy_score
from sklearn.linear_model import LogisticRegression
from sklearn.neighbors import KNeighborsClassifier
from sklearn.tree import DecisionTreeClassifier
from sklearn.svm import SVC
from sklearn.ensemble import RandomForestClassifier
from sklearn.ensemble import GradientBoostingClassifier
from sklearn.pipeline import Pipeline
from sklearn.preprocessing import StandardScaler
# load dataset
train = read_csv('es2_train.csv', header=None)
test = read_csv('es2_test.csv', header=None)
# split into inputs and outputs
trainX, trainy = train.values[:, :-1], train.values[:, -1]
testX, testy = test.values[:, :-1], test.values[:, -1]
# create a list of models to evaluate
models, names = list(), list()
# logistic
models.append(LogisticRegression())
names.append('LR')
# knn
models.append(KNeighborsClassifier())
names.append('KNN')
# knn
models.append(KNeighborsClassifier(n_neighbors=7))
names.append('KNN-7')
# cart
models.append(DecisionTreeClassifier())
names.append('CART')
# svm
models.append(SVC())
names.append('SVM')
# random forest
models.append(RandomForestClassifier())
names.append('RF')
# gbm
models.append(GradientBoostingClassifier())
names.append('GBM')
# evaluate models
all_scores = list()
for i in range(len(models)):
# create a pipeline for the model
scaler = StandardScaler()
model = Pipeline(steps=[('s',scaler), ('m',models[i])])
# fit
# model = models[i]
model.fit(trainX, trainy)
# predict
yhat = model.predict(testX)
# evaluate
score = accuracy_score(testy, yhat) * 100
all_scores.append(score)
# summarize
print('%s %.3f%%' % (names[i], score))
# plot
pyplot.bar(names, all_scores)
pyplot.show()
```
运行该示例报告 ES2 方案的模型准确性。
我们可以看到 KNN 表现良好,并且发现在 ES1 上表现良好的七个邻居的 KNN 在 ES2 上也表现良好。
```py
LR 45.192%
KNN 54.808%
KNN-7 57.692%
CART 53.846%
SVM 51.923%
RF 53.846%
GBM 52.885%
```
精度分数的条形图有助于使方法之间的表现相对差异更加清晰。
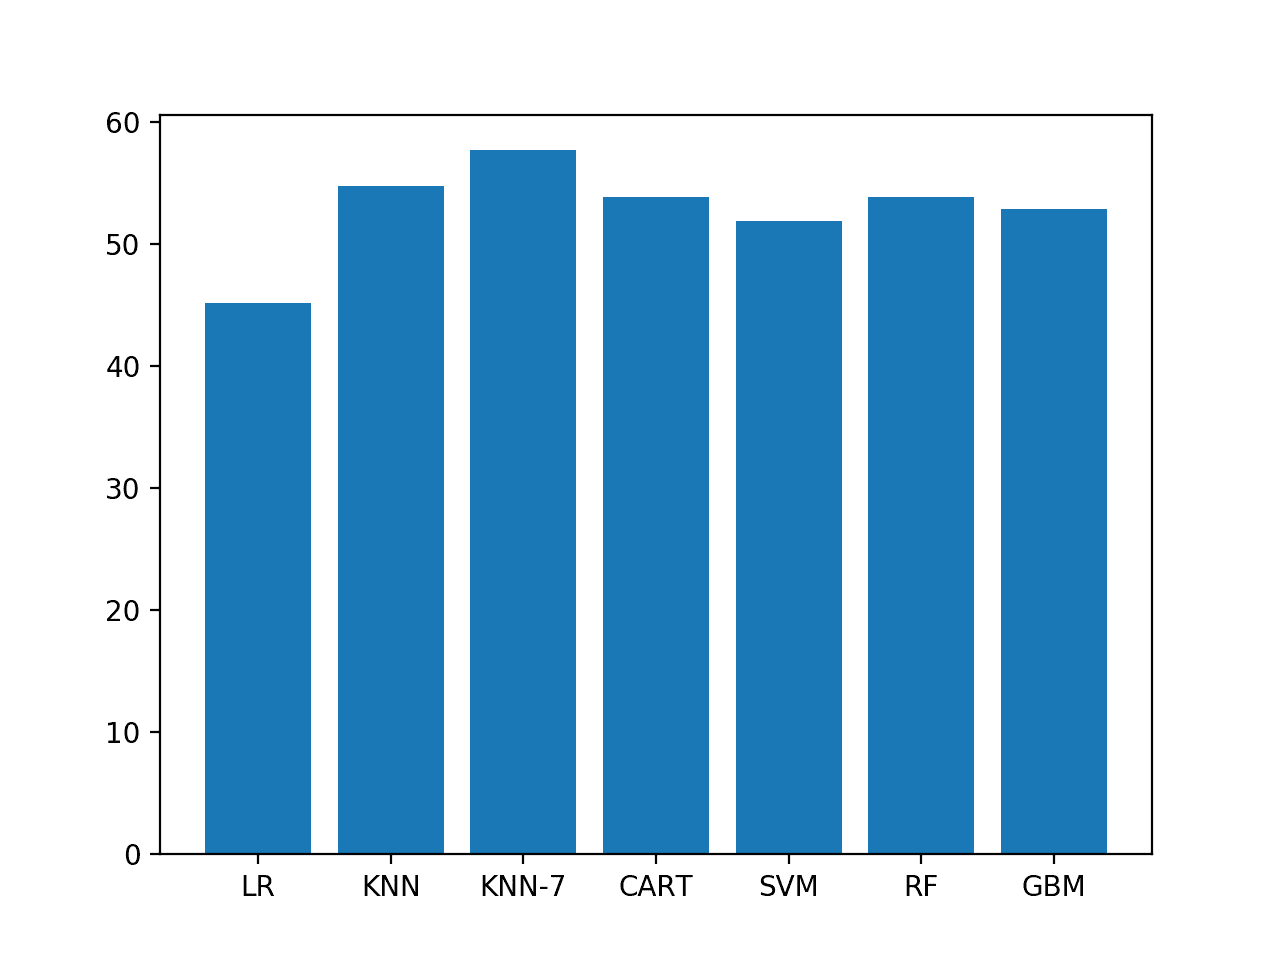
ES2 上模型精度的条形图
所选择的表示和模型配置确实具有超过预测的技能,准确度为 50%。
进一步调整可能会使模型具有更好的技能,我们距离 ES1 和 ES2 分别报告的 95%和 89%准确度还有很长的路要走。
### 扩展
本节列出了一些扩展您可能希望探索的教程的想法。
* **数据准备**。有很多机会可以探索更多的数据准备方法,例如归一化,差分和功率变换。
* **特色工程**。进一步的特征工程可以产生更好的表现模型,例如每个序列的开始,中间和结束的统计以及趋势信息。
* **调整**。只有 KNN 算法才有机会进行调整;梯度增强等其他模型可以从超参数的微调中受益。
* **RNNs** 。该序列分类任务似乎非常适合于循环神经网络,例如支持可变长度多变量输入的 LSTM。对该数据集进行的一些初步测试(由我自己)显示出非常不稳定的结果,但更广泛的调查可能会给出更好甚至更好的结果。
如果你探索任何这些扩展,我很想知道。
## 进一步阅读
如果您希望深入了解,本节将提供有关该主题的更多资源。
### 文件
* [通过油藏计算预测用户在异质室内环境中的移动](https://pdfs.semanticscholar.org/40c2/393e1874c3fd961fdfff02402c24ccf1c3d7.pdf#page=13),2011。
* [环境辅助生活应用中储层计算的实验表征](https://link.springer.com/article/10.1007/s00521-013-1364-4),2014。
### API
* [sklearn.model_selection.cross_val_score API](http://scikit-learn.org/stable/modules/generated/sklearn.model_selection.cross_val_score.html)
* [numpy.linalg.lstsq API](https://docs.scipy.org/doc/numpy/reference/generated/numpy.linalg.lstsq.html)
* [numpy.pad API](https://docs.scipy.org/doc/numpy/reference/generated/numpy.pad.html)
### 用品
* [来自 RSS 数据集的室内用户移动预测,UCI 机器学习库](https://archive.ics.uci.edu/ml/datasets/Indoor+User+Movement+Prediction+from+RSS+data)
* [通过油藏计算预测非均质室内环境中的用户移动,Paolo Barsocchi 主页](http://wnlab.isti.cnr.it/paolo/index.php/dataset/6rooms)。
* [来自 RSS 数据集](https://github.com/Laurae2/Indoor_Prediction)的室内用户移动预测,Laurae [法语]。
## 摘要
在本教程中,您发现了室内运动预测时间序列分类问题以及如何设计功能并评估问题的机器学习算法。
具体来说,你学到了:
* 基于传感器强度预测房间运动的时间序列分类问题。
* 如何调查数据以便更好地理解问题以及如何从原始数据中设计特征以进行预测建模。
* 如何检查一套分类算法并调整一种算法以进一步提高问题的表现。
你有任何问题吗?
在下面的评论中提出您的问题,我会尽力回答。
- Machine Learning Mastery 应用机器学习教程
- 5竞争机器学习的好处
- 过度拟合的简单直觉,或者为什么测试训练数据是一个坏主意
- 特征选择简介
- 应用机器学习作为一个搜索问题的温和介绍
- 为什么应用机器学习很难
- 为什么我的结果不如我想的那么好?你可能过度拟合了
- 用ROC曲线评估和比较分类器表现
- BigML评论:发现本机学习即服务平台的聪明功能
- BigML教程:开发您的第一个决策树并进行预测
- 构建生产机器学习基础设施
- 分类准确性不够:可以使用更多表现测量
- 一种预测模型的巧妙应用
- 机器学习项目中常见的陷阱
- 数据清理:将凌乱的数据转换为整洁的数据
- 机器学习中的数据泄漏
- 数据,学习和建模
- 数据管理至关重要以及为什么需要认真对待它
- 将预测模型部署到生产中
- 参数和超参数之间有什么区别?
- 测试和验证数据集之间有什么区别?
- 发现特征工程,如何设计特征以及如何获得它
- 如何开始使用Kaggle
- 超越预测
- 如何在评估机器学习算法时选择正确的测试选项
- 如何定义机器学习问题
- 如何评估机器学习算法
- 如何获得基线结果及其重要性
- 如何充分利用机器学习数据
- 如何识别数据中的异常值
- 如何提高机器学习效果
- 如何在竞争机器学习中踢屁股
- 如何知道您的机器学习模型是否具有良好的表现
- 如何布局和管理您的机器学习项目
- 如何为机器学习准备数据
- 如何减少最终机器学习模型中的方差
- 如何使用机器学习结果
- 如何解决像数据科学家这样的问题
- 通过数据预处理提高模型精度
- 处理机器学习的大数据文件的7种方法
- 建立机器学习系统的经验教训
- 如何使用机器学习清单可靠地获得准确的预测(即使您是初学者)
- 机器学习模型运行期间要做什么
- 机器学习表现改进备忘单
- 来自世界级从业者的机器学习技巧:Phil Brierley
- 模型预测精度与机器学习中的解释
- 竞争机器学习的模型选择技巧
- 机器学习需要多少训练数据?
- 如何系统地规划和运行机器学习实验
- 应用机器学习过程
- 默认情况下可重现的机器学习结果
- 10个实践应用机器学习的标准数据集
- 简单的三步法到最佳机器学习算法
- 打击机器学习数据集中不平衡类的8种策略
- 模型表现不匹配问题(以及如何处理)
- 黑箱机器学习的诱惑陷阱
- 如何培养最终的机器学习模型
- 使用探索性数据分析了解您的问题并获得更好的结果
- 什么是数据挖掘和KDD
- 为什么One-Hot在机器学习中编码数据?
- 为什么你应该在你的机器学习问题上进行抽样检查算法
- 所以,你正在研究机器学习问题......
- Machine Learning Mastery Keras 深度学习教程
- Keras 中神经网络模型的 5 步生命周期
- 在 Python 迷你课程中应用深度学习
- Keras 深度学习库的二元分类教程
- 如何用 Keras 构建多层感知器神经网络模型
- 如何在 Keras 中检查深度学习模型
- 10 个用于 Amazon Web Services 深度学习的命令行秘籍
- 机器学习卷积神经网络的速成课程
- 如何在 Python 中使用 Keras 进行深度学习的度量
- 深度学习书籍
- 深度学习课程
- 你所知道的深度学习是一种谎言
- 如何设置 Amazon AWS EC2 GPU 以训练 Keras 深度学习模型(分步)
- 神经网络中批量和迭代之间的区别是什么?
- 在 Keras 展示深度学习模型训练历史
- 基于 Keras 的深度学习模型中的dropout正则化
- 评估 Keras 中深度学习模型的表现
- 如何评价深度学习模型的技巧
- 小批量梯度下降的简要介绍以及如何配置批量大小
- 在 Keras 中获得深度学习帮助的 9 种方法
- 如何使用 Keras 在 Python 中网格搜索深度学习模型的超参数
- 用 Keras 在 Python 中使用卷积神经网络进行手写数字识别
- 如何用 Keras 进行预测
- 用 Keras 进行深度学习的图像增强
- 8 个深度学习的鼓舞人心的应用
- Python 深度学习库 Keras 简介
- Python 深度学习库 TensorFlow 简介
- Python 深度学习库 Theano 简介
- 如何使用 Keras 函数式 API 进行深度学习
- Keras 深度学习库的多类分类教程
- 多层感知器神经网络速成课程
- 基于卷积神经网络的 Keras 深度学习库中的目标识别
- 流行的深度学习库
- 用深度学习预测电影评论的情感
- Python 中的 Keras 深度学习库的回归教程
- 如何使用 Keras 获得可重现的结果
- 如何在 Linux 服务器上运行深度学习实验
- 保存并加载您的 Keras 深度学习模型
- 用 Keras 逐步开发 Python 中的第一个神经网络
- 用 Keras 理解 Python 中的有状态 LSTM 循环神经网络
- 在 Python 中使用 Keras 深度学习模型和 Scikit-Learn
- 如何使用预训练的 VGG 模型对照片中的物体进行分类
- 在 Python 和 Keras 中对深度学习模型使用学习率调度
- 如何在 Keras 中可视化深度学习神经网络模型
- 什么是深度学习?
- 何时使用 MLP,CNN 和 RNN 神经网络
- 为什么用随机权重初始化神经网络?
- Machine Learning Mastery 深度学习 NLP 教程
- 深度学习在自然语言处理中的 7 个应用
- 如何实现自然语言处理的波束搜索解码器
- 深度学习文档分类的最佳实践
- 关于自然语言处理的热门书籍
- 在 Python 中计算文本 BLEU 分数的温和介绍
- 使用编码器 - 解码器模型的用于字幕生成的注入和合并架构
- 如何用 Python 清理机器学习的文本
- 如何配置神经机器翻译的编码器 - 解码器模型
- 如何开始深度学习自然语言处理(7 天迷你课程)
- 自然语言处理的数据集
- 如何开发一种深度学习的词袋模型来预测电影评论情感
- 深度学习字幕生成模型的温和介绍
- 如何在 Keras 中定义神经机器翻译的编码器 - 解码器序列 - 序列模型
- 如何利用小实验在 Keras 中开发字幕生成模型
- 如何从头开发深度学习图片标题生成器
- 如何在 Keras 中开发基于字符的神经语言模型
- 如何开发用于情感分析的 N-gram 多通道卷积神经网络
- 如何从零开始开发神经机器翻译系统
- 如何在 Python 中用 Keras 开发基于单词的神经语言模型
- 如何开发一种预测电影评论情感的词嵌入模型
- 如何使用 Gensim 在 Python 中开发词嵌入
- 用于文本摘要的编码器 - 解码器深度学习模型
- Keras 中文本摘要的编码器 - 解码器模型
- 用于神经机器翻译的编码器 - 解码器循环神经网络模型
- 浅谈词袋模型
- 文本摘要的温和介绍
- 编码器 - 解码器循环神经网络中的注意力如何工作
- 如何利用深度学习自动生成照片的文本描述
- 如何开发一个单词级神经语言模型并用它来生成文本
- 浅谈神经机器翻译
- 什么是自然语言处理?
- 牛津自然语言处理深度学习课程
- 如何为机器翻译准备法语到英语的数据集
- 如何为情感分析准备电影评论数据
- 如何为文本摘要准备新闻文章
- 如何准备照片标题数据集以训练深度学习模型
- 如何使用 Keras 为深度学习准备文本数据
- 如何使用 scikit-learn 为机器学习准备文本数据
- 自然语言处理神经网络模型入门
- 对自然语言处理的深度学习的承诺
- 在 Python 中用 Keras 进行 LSTM 循环神经网络的序列分类
- 斯坦福自然语言处理深度学习课程评价
- 统计语言建模和神经语言模型的简要介绍
- 使用 Keras 在 Python 中进行 LSTM 循环神经网络的文本生成
- 浅谈机器学习中的转换
- 如何使用 Keras 将词嵌入层用于深度学习
- 什么是用于文本的词嵌入
- Machine Learning Mastery 深度学习时间序列教程
- 如何开发人类活动识别的一维卷积神经网络模型
- 人类活动识别的深度学习模型
- 如何评估人类活动识别的机器学习算法
- 时间序列预测的多层感知器网络探索性配置
- 比较经典和机器学习方法进行时间序列预测的结果
- 如何通过深度学习快速获得时间序列预测的结果
- 如何利用 Python 处理序列预测问题中的缺失时间步长
- 如何建立预测大气污染日的概率预测模型
- 如何开发一种熟练的机器学习时间序列预测模型
- 如何构建家庭用电自回归预测模型
- 如何开发多步空气污染时间序列预测的自回归预测模型
- 如何制定多站点多元空气污染时间序列预测的基线预测
- 如何开发时间序列预测的卷积神经网络模型
- 如何开发卷积神经网络用于多步时间序列预测
- 如何开发单变量时间序列预测的深度学习模型
- 如何开发 LSTM 模型用于家庭用电的多步时间序列预测
- 如何开发 LSTM 模型进行时间序列预测
- 如何开发多元多步空气污染时间序列预测的机器学习模型
- 如何开发多层感知器模型进行时间序列预测
- 如何开发人类活动识别时间序列分类的 RNN 模型
- 如何开始深度学习的时间序列预测(7 天迷你课程)
- 如何网格搜索深度学习模型进行时间序列预测
- 如何对单变量时间序列预测的网格搜索朴素方法
- 如何在 Python 中搜索 SARIMA 模型超参数用于时间序列预测
- 如何在 Python 中进行时间序列预测的网格搜索三次指数平滑
- 一个标准的人类活动识别问题的温和介绍
- 如何加载和探索家庭用电数据
- 如何加载,可视化和探索复杂的多变量多步时间序列预测数据集
- 如何从智能手机数据模拟人类活动
- 如何根据环境因素预测房间占用率
- 如何使用脑波预测人眼是开放还是闭合
- 如何在 Python 中扩展长短期内存网络的数据
- 如何使用 TimeseriesGenerator 进行 Keras 中的时间序列预测
- 基于机器学习算法的室内运动时间序列分类
- 用于时间序列预测的状态 LSTM 在线学习的不稳定性
- 用于罕见事件时间序列预测的 LSTM 模型体系结构
- 用于时间序列预测的 4 种通用机器学习数据变换
- Python 中长短期记忆网络的多步时间序列预测
- 家庭用电机器学习的多步时间序列预测
- Keras 中 LSTM 的多变量时间序列预测
- 如何开发和评估朴素的家庭用电量预测方法
- 如何为长短期记忆网络准备单变量时间序列数据
- 循环神经网络在时间序列预测中的应用
- 如何在 Python 中使用差异变换删除趋势和季节性
- 如何在 LSTM 中种子状态用于 Python 中的时间序列预测
- 使用 Python 进行时间序列预测的有状态和无状态 LSTM
- 长短时记忆网络在时间序列预测中的适用性
- 时间序列预测问题的分类
- Python 中长短期记忆网络的时间序列预测
- 基于 Keras 的 Python 中 LSTM 循环神经网络的时间序列预测
- Keras 中深度学习的时间序列预测
- 如何用 Keras 调整 LSTM 超参数进行时间序列预测
- 如何在时间序列预测训练期间更新 LSTM 网络
- 如何使用 LSTM 网络的 Dropout 进行时间序列预测
- 如何使用 LSTM 网络中的特征进行时间序列预测
- 如何在 LSTM 网络中使用时间序列进行时间序列预测
- 如何利用 LSTM 网络进行权重正则化进行时间序列预测
- Machine Learning Mastery 线性代数教程
- 机器学习数学符号的基础知识
- 用 NumPy 阵列轻松介绍广播
- 如何从 Python 中的 Scratch 计算主成分分析(PCA)
- 用于编码器审查的计算线性代数
- 10 机器学习中的线性代数示例
- 线性代数的温和介绍
- 用 NumPy 轻松介绍 Python 中的 N 维数组
- 机器学习向量的温和介绍
- 如何在 Python 中为机器学习索引,切片和重塑 NumPy 数组
- 机器学习的矩阵和矩阵算法简介
- 温和地介绍机器学习的特征分解,特征值和特征向量
- NumPy 对预期价值,方差和协方差的简要介绍
- 机器学习矩阵分解的温和介绍
- 用 NumPy 轻松介绍机器学习的张量
- 用于机器学习的线性代数中的矩阵类型简介
- 用于机器学习的线性代数备忘单
- 线性代数的深度学习
- 用于机器学习的线性代数(7 天迷你课程)
- 机器学习的线性代数
- 机器学习矩阵运算的温和介绍
- 线性代数评论没有废话指南
- 学习机器学习线性代数的主要资源
- 浅谈机器学习的奇异值分解
- 如何用线性代数求解线性回归
- 用于机器学习的稀疏矩阵的温和介绍
- 机器学习中向量规范的温和介绍
- 学习线性代数用于机器学习的 5 个理由
- Machine Learning Mastery LSTM 教程
- Keras中长短期记忆模型的5步生命周期
- 长短时记忆循环神经网络的注意事项
- CNN长短期记忆网络
- 逆向神经网络中的深度学习速成课程
- 可变长度输入序列的数据准备
- 如何用Keras开发用于Python序列分类的双向LSTM
- 如何开发Keras序列到序列预测的编码器 - 解码器模型
- 如何诊断LSTM模型的过度拟合和欠拟合
- 如何开发一种编码器 - 解码器模型,注重Keras中的序列到序列预测
- 编码器 - 解码器长短期存储器网络
- 神经网络中爆炸梯度的温和介绍
- 对时间反向传播的温和介绍
- 生成长短期记忆网络的温和介绍
- 专家对长短期记忆网络的简要介绍
- 在序列预测问题上充分利用LSTM
- 编辑器 - 解码器循环神经网络全局注意的温和介绍
- 如何利用长短时记忆循环神经网络处理很长的序列
- 如何在Python中对一个热编码序列数据
- 如何使用编码器 - 解码器LSTM来回显随机整数序列
- 具有注意力的编码器 - 解码器RNN体系结构的实现模式
- 学习使用编码器解码器LSTM循环神经网络添加数字
- 如何学习长短时记忆循环神经网络回声随机整数
- 具有Keras的长短期记忆循环神经网络的迷你课程
- LSTM自动编码器的温和介绍
- 如何用Keras中的长短期记忆模型进行预测
- 用Python中的长短期内存网络演示内存
- 基于循环神经网络的序列预测模型的简要介绍
- 深度学习的循环神经网络算法之旅
- 如何重塑Keras中长短期存储网络的输入数据
- 了解Keras中LSTM的返回序列和返回状态之间的差异
- RNN展开的温和介绍
- 5学习LSTM循环神经网络的简单序列预测问题的例子
- 使用序列进行预测
- 堆叠长短期内存网络
- 什么是教师强制循环神经网络?
- 如何在Python中使用TimeDistributed Layer for Long Short-Term Memory Networks
- 如何准备Keras中截断反向传播的序列预测
- 如何在使用LSTM进行训练和预测时使用不同的批量大小
- Machine Learning Mastery 机器学习算法教程
- 机器学习算法之旅
- 用于机器学习的装袋和随机森林集合算法
- 从头开始实施机器学习算法的好处
- 更好的朴素贝叶斯:从朴素贝叶斯算法中获取最多的12个技巧
- 机器学习的提升和AdaBoost
- 选择机器学习算法:Microsoft Azure的经验教训
- 机器学习的分类和回归树
- 什么是机器学习中的混淆矩阵
- 如何使用Python从头开始创建算法测试工具
- 通过创建机器学习算法的目标列表来控制
- 从头开始停止编码机器学习算法
- 在实现机器学习算法时,不要从开源代码开始
- 不要使用随机猜测作为基线分类器
- 浅谈机器学习中的概念漂移
- 温和介绍机器学习中的偏差 - 方差权衡
- 机器学习的梯度下降
- 机器学习算法如何工作(他们学习输入到输出的映射)
- 如何建立机器学习算法的直觉
- 如何实现机器学习算法
- 如何研究机器学习算法行为
- 如何学习机器学习算法
- 如何研究机器学习算法
- 如何研究机器学习算法
- 如何在Python中从头开始实现反向传播算法
- 如何用Python从头开始实现Bagging
- 如何用Python从头开始实现基线机器学习算法
- 如何在Python中从头开始实现决策树算法
- 如何用Python从头开始实现学习向量量化
- 如何利用Python从头开始随机梯度下降实现线性回归
- 如何利用Python从头开始随机梯度下降实现Logistic回归
- 如何用Python从头开始实现机器学习算法表现指标
- 如何在Python中从头开始实现感知器算法
- 如何在Python中从零开始实现随机森林
- 如何在Python中从头开始实现重采样方法
- 如何用Python从头开始实现简单线性回归
- 如何用Python从头开始实现堆栈泛化(Stacking)
- K-Nearest Neighbors for Machine Learning
- 学习机器学习的向量量化
- 机器学习的线性判别分析
- 机器学习的线性回归
- 使用梯度下降进行机器学习的线性回归教程
- 如何在Python中从头开始加载机器学习数据
- 机器学习的Logistic回归
- 机器学习的Logistic回归教程
- 机器学习算法迷你课程
- 如何在Python中从头开始实现朴素贝叶斯
- 朴素贝叶斯机器学习
- 朴素贝叶斯机器学习教程
- 机器学习算法的过拟合和欠拟合
- 参数化和非参数机器学习算法
- 理解任何机器学习算法的6个问题
- 在机器学习中拥抱随机性
- 如何使用Python从头开始扩展机器学习数据
- 机器学习的简单线性回归教程
- 有监督和无监督的机器学习算法
- 用于机器学习的支持向量机
- 在没有数学背景的情况下理解机器学习算法的5种技术
- 最好的机器学习算法
- 教程从头开始在Python中实现k-Nearest Neighbors
- 通过从零开始实现它们来理解机器学习算法(以及绕过坏代码的策略)
- 使用随机森林:在121个数据集上测试179个分类器
- 为什么从零开始实现机器学习算法
- Machine Learning Mastery 机器学习入门教程
- 机器学习入门的四个步骤:初学者入门与实践的自上而下策略
- 你应该培养的 5 个机器学习领域
- 一种选择机器学习算法的数据驱动方法
- 机器学习中的分析与数值解
- 应用机器学习是一种精英政治
- 机器学习的基本概念
- 如何成为数据科学家
- 初学者如何在机器学习中弄错
- 机器学习的最佳编程语言
- 构建机器学习组合
- 机器学习中分类与回归的区别
- 评估自己作为数据科学家并利用结果建立惊人的数据科学团队
- 探索 Kaggle 大师的方法论和心态:对 Diogo Ferreira 的采访
- 扩展机器学习工具并展示掌握
- 通过寻找地标开始机器学习
- 温和地介绍预测建模
- 通过提供结果在机器学习中获得梦想的工作
- 如何开始机器学习:自学蓝图
- 开始并在机器学习方面取得进展
- 应用机器学习的 Hello World
- 初学者如何使用小型项目开始机器学习并在 Kaggle 上进行竞争
- 我如何开始机器学习? (简短版)
- 我是如何开始机器学习的
- 如何在机器学习中取得更好的成绩
- 如何从在银行工作到担任 Target 的高级数据科学家
- 如何学习任何机器学习工具
- 使用小型目标项目深入了解机器学习工具
- 获得付费申请机器学习
- 映射机器学习工具的景观
- 机器学习开发环境
- 机器学习金钱
- 程序员的机器学习
- 机器学习很有意思
- 机器学习是 Kaggle 比赛
- 机器学习现在很受欢迎
- 机器学习掌握方法
- 机器学习很重要
- 机器学习 Q& A:概念漂移,更好的结果和学习更快
- 缺乏自学机器学习的路线图
- 机器学习很重要
- 快速了解任何机器学习工具(即使您是初学者)
- 机器学习工具
- 找到你的机器学习部落
- 机器学习在一年
- 通过竞争一致的大师 Kaggle
- 5 程序员在机器学习中开始犯错误
- 哲学毕业生到机器学习从业者(Brian Thomas 采访)
- 机器学习入门的实用建议
- 实用机器学习问题
- 使用来自 UCI 机器学习库的数据集练习机器学习
- 使用秘籍的任何机器学习工具快速启动
- 程序员可以进入机器学习
- 程序员应该进入机器学习
- 项目焦点:Shashank Singh 的人脸识别
- 项目焦点:使用 Mahout 和 Konstantin Slisenko 进行堆栈交换群集
- 机器学习自学指南
- 4 个自学机器学习项目
- ÁlvaroLemos 如何在数据科学团队中获得机器学习实习
- 如何思考机器学习
- 现实世界机器学习问题之旅
- 有关机器学习的有用知识
- 如果我没有学位怎么办?
- 如果我不是一个优秀的程序员怎么办?
- 如果我不擅长数学怎么办?
- 为什么机器学习算法会处理以前从未见过的数据?
- 是什么阻碍了你的机器学习目标?
- 什么是机器学习?
- 机器学习适合哪里?
- 为什么要进入机器学习?
- 研究对您来说很重要的机器学习问题
- 你这样做是错的。为什么机器学习不必如此困难
- Machine Learning Mastery Sklearn 教程
- Scikit-Learn 的温和介绍:Python 机器学习库
- 使用 Python 管道和 scikit-learn 自动化机器学习工作流程
- 如何以及何时使用带有 scikit-learn 的校准分类模型
- 如何比较 Python 中的机器学习算法与 scikit-learn
- 用于机器学习开发人员的 Python 崩溃课程
- 用 scikit-learn 在 Python 中集成机器学习算法
- 使用重采样评估 Python 中机器学习算法的表现
- 使用 Scikit-Learn 在 Python 中进行特征选择
- Python 中机器学习的特征选择
- 如何使用 scikit-learn 在 Python 中生成测试数据集
- scikit-learn 中的机器学习算法秘籍
- 如何使用 Python 处理丢失的数据
- 如何开始使用 Python 进行机器学习
- 如何使用 Scikit-Learn 在 Python 中加载数据
- Python 中概率评分方法的简要介绍
- 如何用 Scikit-Learn 调整算法参数
- 如何在 Mac OS X 上安装 Python 3 环境以进行机器学习和深度学习
- 使用 scikit-learn 进行机器学习简介
- 从 shell 到一本带有 Fernando Perez 单一工具的书的 IPython
- 如何使用 Python 3 为机器学习开发创建 Linux 虚拟机
- 如何在 Python 中加载机器学习数据
- 您在 Python 中的第一个机器学习项目循序渐进
- 如何使用 scikit-learn 进行预测
- 用于评估 Python 中机器学习算法的度量标准
- 使用 Pandas 为 Python 中的机器学习准备数据
- 如何使用 Scikit-Learn 为 Python 机器学习准备数据
- 项目焦点:使用 Artem Yankov 在 Python 中进行事件推荐
- 用于机器学习的 Python 生态系统
- Python 是应用机器学习的成长平台
- Python 机器学习书籍
- Python 机器学习迷你课程
- 使用 Pandas 快速和肮脏的数据分析
- 使用 Scikit-Learn 重新调整 Python 中的机器学习数据
- 如何以及何时使用 ROC 曲线和精确调用曲线进行 Python 分类
- 使用 scikit-learn 在 Python 中保存和加载机器学习模型
- scikit-learn Cookbook 书评
- 如何使用 Anaconda 为机器学习和深度学习设置 Python 环境
- 使用 scikit-learn 在 Python 中进行 Spot-Check 分类机器学习算法
- 如何在 Python 中开发可重复使用的抽样检查算法框架
- 使用 scikit-learn 在 Python 中进行 Spot-Check 回归机器学习算法
- 使用 Python 中的描述性统计来了解您的机器学习数据
- 使用 OpenCV,Python 和模板匹配来播放“哪里是 Waldo?”
- 使用 Pandas 在 Python 中可视化机器学习数据
- Machine Learning Mastery 统计学教程
- 浅谈计算正态汇总统计量
- 非参数统计的温和介绍
- Python中常态测试的温和介绍
- 浅谈Bootstrap方法
- 浅谈机器学习的中心极限定理
- 浅谈机器学习中的大数定律
- 机器学习的所有统计数据
- 如何计算Python中机器学习结果的Bootstrap置信区间
- 浅谈机器学习的Chi-Squared测试
- 机器学习的置信区间
- 随机化在机器学习中解决混杂变量的作用
- 机器学习中的受控实验
- 机器学习统计学速成班
- 统计假设检验的关键值以及如何在Python中计算它们
- 如何在机器学习中谈论数据(统计学和计算机科学术语)
- Python中数据可视化方法的简要介绍
- Python中效果大小度量的温和介绍
- 估计随机机器学习算法的实验重复次数
- 机器学习评估统计的温和介绍
- 如何计算Python中的非参数秩相关性
- 如何在Python中计算数据的5位数摘要
- 如何在Python中从头开始编写学生t检验
- 如何在Python中生成随机数
- 如何转换数据以更好地拟合正态分布
- 如何使用相关来理解变量之间的关系
- 如何使用统计信息识别数据中的异常值
- 用于Python机器学习的随机数生成器简介
- k-fold交叉验证的温和介绍
- 如何计算McNemar的比较两种机器学习量词的测试
- Python中非参数统计显着性测试简介
- 如何在Python中使用参数统计显着性测试
- 机器学习的预测间隔
- 应用统计学与机器学习的密切关系
- 如何使用置信区间报告分类器表现
- 统计数据分布的简要介绍
- 15 Python中的统计假设检验(备忘单)
- 统计假设检验的温和介绍
- 10如何在机器学习项目中使用统计方法的示例
- Python中统计功效和功耗分析的简要介绍
- 统计抽样和重新抽样的简要介绍
- 比较机器学习算法的统计显着性检验
- 机器学习中统计容差区间的温和介绍
- 机器学习统计书籍
- 评估机器学习模型的统计数据
- 机器学习统计(7天迷你课程)
- 用于机器学习的简明英语统计
- 如何使用统计显着性检验来解释机器学习结果
- 什么是统计(为什么它在机器学习中很重要)?
- Machine Learning Mastery 时间序列入门教程
- 如何在 Python 中为时间序列预测创建 ARIMA 模型
- 用 Python 进行时间序列预测的自回归模型
- 如何回溯机器学习模型的时间序列预测
- Python 中基于时间序列数据的基本特征工程
- R 的时间序列预测热门书籍
- 10 挑战机器学习时间序列预测问题
- 如何将时间序列转换为 Python 中的监督学习问题
- 如何将时间序列数据分解为趋势和季节性
- 如何用 ARCH 和 GARCH 模拟波动率进行时间序列预测
- 如何将时间序列数据集与 Python 区分开来
- Python 中时间序列预测的指数平滑的温和介绍
- 用 Python 进行时间序列预测的特征选择
- 浅谈自相关和部分自相关
- 时间序列预测的 Box-Jenkins 方法简介
- 用 Python 简要介绍时间序列的时间序列预测
- 如何使用 Python 网格搜索 ARIMA 模型超参数
- 如何在 Python 中加载和探索时间序列数据
- 如何使用 Python 对 ARIMA 模型进行手动预测
- 如何用 Python 进行时间序列预测的预测
- 如何使用 Python 中的 ARIMA 进行样本外预测
- 如何利用 Python 模拟残差错误来纠正时间序列预测
- 使用 Python 进行数据准备,特征工程和时间序列预测的移动平均平滑
- 多步时间序列预测的 4 种策略
- 如何在 Python 中规范化和标准化时间序列数据
- 如何利用 Python 进行时间序列预测的基线预测
- 如何使用 Python 对时间序列预测数据进行功率变换
- 用于时间序列预测的 Python 环境
- 如何重构时间序列预测问题
- 如何使用 Python 重新采样和插值您的时间序列数据
- 用 Python 编写 SARIMA 时间序列预测
- 如何在 Python 中保存 ARIMA 时间序列预测模型
- 使用 Python 进行季节性持久性预测
- 基于 ARIMA 的 Python 历史规模敏感性预测技巧分析
- 简单的时间序列预测模型进行测试,这样你就不会欺骗自己
- 标准多变量,多步骤和多站点时间序列预测问题
- 如何使用 Python 检查时间序列数据是否是固定的
- 使用 Python 进行时间序列数据可视化
- 7 个机器学习的时间序列数据集
- 时间序列预测案例研究与 Python:波士顿每月武装抢劫案
- Python 的时间序列预测案例研究:巴尔的摩的年度用水量
- 使用 Python 进行时间序列预测研究:法国香槟的月销售额
- 使用 Python 的置信区间理解时间序列预测不确定性
- 11 Python 中的经典时间序列预测方法(备忘单)
- 使用 Python 进行时间序列预测表现测量
- 使用 Python 7 天迷你课程进行时间序列预测
- 时间序列预测作为监督学习
- 什么是时间序列预测?
- 如何使用 Python 识别和删除时间序列数据的季节性
- 如何在 Python 中使用和删除时间序列数据中的趋势信息
- 如何在 Python 中调整 ARIMA 参数
- 如何用 Python 可视化时间序列残差预测错误
- 白噪声时间序列与 Python
- 如何通过时间序列预测项目
- Machine Learning Mastery XGBoost 教程
- 通过在 Python 中使用 XGBoost 提前停止来避免过度拟合
- 如何在 Python 中调优 XGBoost 的多线程支持
- 如何配置梯度提升算法
- 在 Python 中使用 XGBoost 进行梯度提升的数据准备
- 如何使用 scikit-learn 在 Python 中开发您的第一个 XGBoost 模型
- 如何在 Python 中使用 XGBoost 评估梯度提升模型
- 在 Python 中使用 XGBoost 的特征重要性和特征选择
- 浅谈机器学习的梯度提升算法
- 应用机器学习的 XGBoost 简介
- 如何在 macOS 上为 Python 安装 XGBoost
- 如何在 Python 中使用 XGBoost 保存梯度提升模型
- 从梯度提升开始,比较 165 个数据集上的 13 种算法
- 在 Python 中使用 XGBoost 和 scikit-learn 进行随机梯度提升
- 如何使用 Amazon Web Services 在云中训练 XGBoost 模型
- 在 Python 中使用 XGBoost 调整梯度提升的学习率
- 如何在 Python 中使用 XGBoost 调整决策树的数量和大小
- 如何在 Python 中使用 XGBoost 可视化梯度提升决策树
- 在 Python 中开始使用 XGBoost 的 7 步迷你课程
