# 如何在 Python 中使用 XGBoost 可视化梯度提升决策树
> 原文: [https://machinelearningmastery.com/visualize-gradient-boosting-decision-trees-xgboost-python/](https://machinelearningmastery.com/visualize-gradient-boosting-decision-trees-xgboost-python/)
绘制单个决策树可以提供对给定数据集的梯度提升过程的深入了解。
在本教程中,您将了解如何使用 Python 中的 XGBoost 从训练好的梯度提升模型中绘制单个决策树。
让我们开始吧。
* **更新 March / 2018** :添加了备用链接以下载数据集,因为原始图像已被删除。

如何用 Python 中的 XGBoost 可视化梯度提升决策树
[Kaarina Dillabough](https://www.flickr.com/photos/100497095@N02/23895950682/) 的照片,保留一些权利。
## 绘制单个 XGBoost 决策树
[XGBoost Python API](http://xgboost.readthedocs.io/en/latest/python/python_api.html#module-xgboost.plotting) 提供了在经过训练的 XGBoost 模型中绘制决策树的功能。
**plot_tree()**函数提供了此功能,该函数将训练模型作为第一个参数,例如:
```py
plot_tree(model)
```
这将绘制模型中的第一个树(索引 0 处的树)。可以使用 **matplotlib** 和 **pyplot.show()**将该图保存到文件或显示在屏幕上。
此绘图功能要求您安装 [graphviz 库](http://www.graphviz.org/)。
我们可以在 [Pima 印第安人糖尿病数据集](https://archive.ics.uci.edu/ml/datasets/Pima+Indians+Diabetes)上创建一个 XGBoost 模型,并绘制模型中的第一棵树(更新:[从这里下载](https://raw.githubusercontent.com/jbrownlee/Datasets/master/pima-indians-diabetes.data.csv))。完整的代码清单如下:
```py
# plot decision tree
from numpy import loadtxt
from xgboost import XGBClassifier
from xgboost import plot_tree
import matplotlib.pyplot as plt
# load data
dataset = loadtxt('pima-indians-diabetes.csv', delimiter=",")
# split data into X and y
X = dataset[:,0:8]
y = dataset[:,8]
# fit model no training data
model = XGBClassifier()
model.fit(X, y)
# plot single tree
plot_tree(model)
plt.show()
```
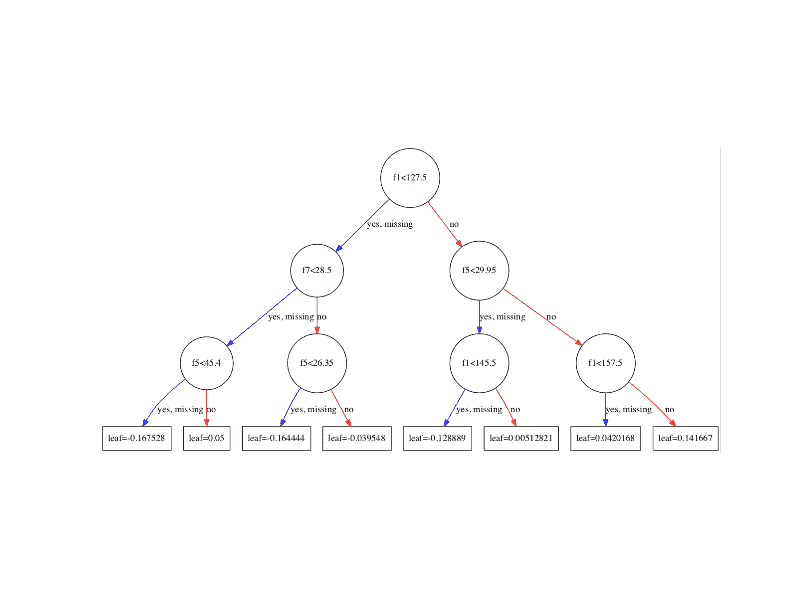
运行代码会在模型中创建第一个决策树(索引 0)的图,显示每个拆分的特征和特征值以及输出叶节点。

单一决策树的 XGBoost 图
您可以看到变量自动命名为 f1 和 f5,与输入数组中的特征索引相对应。
您可以看到每个节点内的拆分决策以及左右分割的不同颜色(蓝色和红色)。
**plot_tree()**函数需要一些参数。您可以通过指定 **num_trees** 参数的索引来绘制特定图形。例如,您可以按顺序绘制序列中的第 5 个提升树:
```py
plot_tree(model, num_trees=4)
```
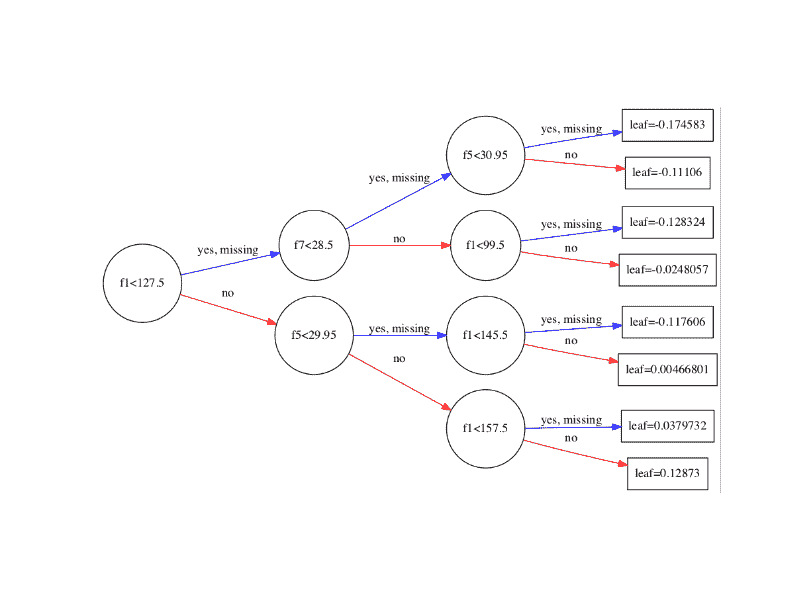
您还可以通过将 **rankdir** 参数更改为“LR”(从左到右)而不是默认的从上到下(UT)来更改图表的布局从左到右(更容易阅读) )。例如:
```py
plot_tree(model, num_trees=0, rankdir='LR')
```
以从左到右的布局绘制树的结果如下所示。

从左到右的单一决策树的 XGBoost 图
## 摘要
在这篇文章中,您学习了如何使用 Python 中训练有素的 XGBoost 梯度提升模型绘制单个决策树。
你有关于在 XGBoost 中绘制决策树或关于这篇文章的任何问题吗?在评论中提出您的问题,我会尽力回答。
- Machine Learning Mastery 应用机器学习教程
- 5竞争机器学习的好处
- 过度拟合的简单直觉,或者为什么测试训练数据是一个坏主意
- 特征选择简介
- 应用机器学习作为一个搜索问题的温和介绍
- 为什么应用机器学习很难
- 为什么我的结果不如我想的那么好?你可能过度拟合了
- 用ROC曲线评估和比较分类器表现
- BigML评论:发现本机学习即服务平台的聪明功能
- BigML教程:开发您的第一个决策树并进行预测
- 构建生产机器学习基础设施
- 分类准确性不够:可以使用更多表现测量
- 一种预测模型的巧妙应用
- 机器学习项目中常见的陷阱
- 数据清理:将凌乱的数据转换为整洁的数据
- 机器学习中的数据泄漏
- 数据,学习和建模
- 数据管理至关重要以及为什么需要认真对待它
- 将预测模型部署到生产中
- 参数和超参数之间有什么区别?
- 测试和验证数据集之间有什么区别?
- 发现特征工程,如何设计特征以及如何获得它
- 如何开始使用Kaggle
- 超越预测
- 如何在评估机器学习算法时选择正确的测试选项
- 如何定义机器学习问题
- 如何评估机器学习算法
- 如何获得基线结果及其重要性
- 如何充分利用机器学习数据
- 如何识别数据中的异常值
- 如何提高机器学习效果
- 如何在竞争机器学习中踢屁股
- 如何知道您的机器学习模型是否具有良好的表现
- 如何布局和管理您的机器学习项目
- 如何为机器学习准备数据
- 如何减少最终机器学习模型中的方差
- 如何使用机器学习结果
- 如何解决像数据科学家这样的问题
- 通过数据预处理提高模型精度
- 处理机器学习的大数据文件的7种方法
- 建立机器学习系统的经验教训
- 如何使用机器学习清单可靠地获得准确的预测(即使您是初学者)
- 机器学习模型运行期间要做什么
- 机器学习表现改进备忘单
- 来自世界级从业者的机器学习技巧:Phil Brierley
- 模型预测精度与机器学习中的解释
- 竞争机器学习的模型选择技巧
- 机器学习需要多少训练数据?
- 如何系统地规划和运行机器学习实验
- 应用机器学习过程
- 默认情况下可重现的机器学习结果
- 10个实践应用机器学习的标准数据集
- 简单的三步法到最佳机器学习算法
- 打击机器学习数据集中不平衡类的8种策略
- 模型表现不匹配问题(以及如何处理)
- 黑箱机器学习的诱惑陷阱
- 如何培养最终的机器学习模型
- 使用探索性数据分析了解您的问题并获得更好的结果
- 什么是数据挖掘和KDD
- 为什么One-Hot在机器学习中编码数据?
- 为什么你应该在你的机器学习问题上进行抽样检查算法
- 所以,你正在研究机器学习问题......
- Machine Learning Mastery Keras 深度学习教程
- Keras 中神经网络模型的 5 步生命周期
- 在 Python 迷你课程中应用深度学习
- Keras 深度学习库的二元分类教程
- 如何用 Keras 构建多层感知器神经网络模型
- 如何在 Keras 中检查深度学习模型
- 10 个用于 Amazon Web Services 深度学习的命令行秘籍
- 机器学习卷积神经网络的速成课程
- 如何在 Python 中使用 Keras 进行深度学习的度量
- 深度学习书籍
- 深度学习课程
- 你所知道的深度学习是一种谎言
- 如何设置 Amazon AWS EC2 GPU 以训练 Keras 深度学习模型(分步)
- 神经网络中批量和迭代之间的区别是什么?
- 在 Keras 展示深度学习模型训练历史
- 基于 Keras 的深度学习模型中的dropout正则化
- 评估 Keras 中深度学习模型的表现
- 如何评价深度学习模型的技巧
- 小批量梯度下降的简要介绍以及如何配置批量大小
- 在 Keras 中获得深度学习帮助的 9 种方法
- 如何使用 Keras 在 Python 中网格搜索深度学习模型的超参数
- 用 Keras 在 Python 中使用卷积神经网络进行手写数字识别
- 如何用 Keras 进行预测
- 用 Keras 进行深度学习的图像增强
- 8 个深度学习的鼓舞人心的应用
- Python 深度学习库 Keras 简介
- Python 深度学习库 TensorFlow 简介
- Python 深度学习库 Theano 简介
- 如何使用 Keras 函数式 API 进行深度学习
- Keras 深度学习库的多类分类教程
- 多层感知器神经网络速成课程
- 基于卷积神经网络的 Keras 深度学习库中的目标识别
- 流行的深度学习库
- 用深度学习预测电影评论的情感
- Python 中的 Keras 深度学习库的回归教程
- 如何使用 Keras 获得可重现的结果
- 如何在 Linux 服务器上运行深度学习实验
- 保存并加载您的 Keras 深度学习模型
- 用 Keras 逐步开发 Python 中的第一个神经网络
- 用 Keras 理解 Python 中的有状态 LSTM 循环神经网络
- 在 Python 中使用 Keras 深度学习模型和 Scikit-Learn
- 如何使用预训练的 VGG 模型对照片中的物体进行分类
- 在 Python 和 Keras 中对深度学习模型使用学习率调度
- 如何在 Keras 中可视化深度学习神经网络模型
- 什么是深度学习?
- 何时使用 MLP,CNN 和 RNN 神经网络
- 为什么用随机权重初始化神经网络?
- Machine Learning Mastery 深度学习 NLP 教程
- 深度学习在自然语言处理中的 7 个应用
- 如何实现自然语言处理的波束搜索解码器
- 深度学习文档分类的最佳实践
- 关于自然语言处理的热门书籍
- 在 Python 中计算文本 BLEU 分数的温和介绍
- 使用编码器 - 解码器模型的用于字幕生成的注入和合并架构
- 如何用 Python 清理机器学习的文本
- 如何配置神经机器翻译的编码器 - 解码器模型
- 如何开始深度学习自然语言处理(7 天迷你课程)
- 自然语言处理的数据集
- 如何开发一种深度学习的词袋模型来预测电影评论情感
- 深度学习字幕生成模型的温和介绍
- 如何在 Keras 中定义神经机器翻译的编码器 - 解码器序列 - 序列模型
- 如何利用小实验在 Keras 中开发字幕生成模型
- 如何从头开发深度学习图片标题生成器
- 如何在 Keras 中开发基于字符的神经语言模型
- 如何开发用于情感分析的 N-gram 多通道卷积神经网络
- 如何从零开始开发神经机器翻译系统
- 如何在 Python 中用 Keras 开发基于单词的神经语言模型
- 如何开发一种预测电影评论情感的词嵌入模型
- 如何使用 Gensim 在 Python 中开发词嵌入
- 用于文本摘要的编码器 - 解码器深度学习模型
- Keras 中文本摘要的编码器 - 解码器模型
- 用于神经机器翻译的编码器 - 解码器循环神经网络模型
- 浅谈词袋模型
- 文本摘要的温和介绍
- 编码器 - 解码器循环神经网络中的注意力如何工作
- 如何利用深度学习自动生成照片的文本描述
- 如何开发一个单词级神经语言模型并用它来生成文本
- 浅谈神经机器翻译
- 什么是自然语言处理?
- 牛津自然语言处理深度学习课程
- 如何为机器翻译准备法语到英语的数据集
- 如何为情感分析准备电影评论数据
- 如何为文本摘要准备新闻文章
- 如何准备照片标题数据集以训练深度学习模型
- 如何使用 Keras 为深度学习准备文本数据
- 如何使用 scikit-learn 为机器学习准备文本数据
- 自然语言处理神经网络模型入门
- 对自然语言处理的深度学习的承诺
- 在 Python 中用 Keras 进行 LSTM 循环神经网络的序列分类
- 斯坦福自然语言处理深度学习课程评价
- 统计语言建模和神经语言模型的简要介绍
- 使用 Keras 在 Python 中进行 LSTM 循环神经网络的文本生成
- 浅谈机器学习中的转换
- 如何使用 Keras 将词嵌入层用于深度学习
- 什么是用于文本的词嵌入
- Machine Learning Mastery 深度学习时间序列教程
- 如何开发人类活动识别的一维卷积神经网络模型
- 人类活动识别的深度学习模型
- 如何评估人类活动识别的机器学习算法
- 时间序列预测的多层感知器网络探索性配置
- 比较经典和机器学习方法进行时间序列预测的结果
- 如何通过深度学习快速获得时间序列预测的结果
- 如何利用 Python 处理序列预测问题中的缺失时间步长
- 如何建立预测大气污染日的概率预测模型
- 如何开发一种熟练的机器学习时间序列预测模型
- 如何构建家庭用电自回归预测模型
- 如何开发多步空气污染时间序列预测的自回归预测模型
- 如何制定多站点多元空气污染时间序列预测的基线预测
- 如何开发时间序列预测的卷积神经网络模型
- 如何开发卷积神经网络用于多步时间序列预测
- 如何开发单变量时间序列预测的深度学习模型
- 如何开发 LSTM 模型用于家庭用电的多步时间序列预测
- 如何开发 LSTM 模型进行时间序列预测
- 如何开发多元多步空气污染时间序列预测的机器学习模型
- 如何开发多层感知器模型进行时间序列预测
- 如何开发人类活动识别时间序列分类的 RNN 模型
- 如何开始深度学习的时间序列预测(7 天迷你课程)
- 如何网格搜索深度学习模型进行时间序列预测
- 如何对单变量时间序列预测的网格搜索朴素方法
- 如何在 Python 中搜索 SARIMA 模型超参数用于时间序列预测
- 如何在 Python 中进行时间序列预测的网格搜索三次指数平滑
- 一个标准的人类活动识别问题的温和介绍
- 如何加载和探索家庭用电数据
- 如何加载,可视化和探索复杂的多变量多步时间序列预测数据集
- 如何从智能手机数据模拟人类活动
- 如何根据环境因素预测房间占用率
- 如何使用脑波预测人眼是开放还是闭合
- 如何在 Python 中扩展长短期内存网络的数据
- 如何使用 TimeseriesGenerator 进行 Keras 中的时间序列预测
- 基于机器学习算法的室内运动时间序列分类
- 用于时间序列预测的状态 LSTM 在线学习的不稳定性
- 用于罕见事件时间序列预测的 LSTM 模型体系结构
- 用于时间序列预测的 4 种通用机器学习数据变换
- Python 中长短期记忆网络的多步时间序列预测
- 家庭用电机器学习的多步时间序列预测
- Keras 中 LSTM 的多变量时间序列预测
- 如何开发和评估朴素的家庭用电量预测方法
- 如何为长短期记忆网络准备单变量时间序列数据
- 循环神经网络在时间序列预测中的应用
- 如何在 Python 中使用差异变换删除趋势和季节性
- 如何在 LSTM 中种子状态用于 Python 中的时间序列预测
- 使用 Python 进行时间序列预测的有状态和无状态 LSTM
- 长短时记忆网络在时间序列预测中的适用性
- 时间序列预测问题的分类
- Python 中长短期记忆网络的时间序列预测
- 基于 Keras 的 Python 中 LSTM 循环神经网络的时间序列预测
- Keras 中深度学习的时间序列预测
- 如何用 Keras 调整 LSTM 超参数进行时间序列预测
- 如何在时间序列预测训练期间更新 LSTM 网络
- 如何使用 LSTM 网络的 Dropout 进行时间序列预测
- 如何使用 LSTM 网络中的特征进行时间序列预测
- 如何在 LSTM 网络中使用时间序列进行时间序列预测
- 如何利用 LSTM 网络进行权重正则化进行时间序列预测
- Machine Learning Mastery 线性代数教程
- 机器学习数学符号的基础知识
- 用 NumPy 阵列轻松介绍广播
- 如何从 Python 中的 Scratch 计算主成分分析(PCA)
- 用于编码器审查的计算线性代数
- 10 机器学习中的线性代数示例
- 线性代数的温和介绍
- 用 NumPy 轻松介绍 Python 中的 N 维数组
- 机器学习向量的温和介绍
- 如何在 Python 中为机器学习索引,切片和重塑 NumPy 数组
- 机器学习的矩阵和矩阵算法简介
- 温和地介绍机器学习的特征分解,特征值和特征向量
- NumPy 对预期价值,方差和协方差的简要介绍
- 机器学习矩阵分解的温和介绍
- 用 NumPy 轻松介绍机器学习的张量
- 用于机器学习的线性代数中的矩阵类型简介
- 用于机器学习的线性代数备忘单
- 线性代数的深度学习
- 用于机器学习的线性代数(7 天迷你课程)
- 机器学习的线性代数
- 机器学习矩阵运算的温和介绍
- 线性代数评论没有废话指南
- 学习机器学习线性代数的主要资源
- 浅谈机器学习的奇异值分解
- 如何用线性代数求解线性回归
- 用于机器学习的稀疏矩阵的温和介绍
- 机器学习中向量规范的温和介绍
- 学习线性代数用于机器学习的 5 个理由
- Machine Learning Mastery LSTM 教程
- Keras中长短期记忆模型的5步生命周期
- 长短时记忆循环神经网络的注意事项
- CNN长短期记忆网络
- 逆向神经网络中的深度学习速成课程
- 可变长度输入序列的数据准备
- 如何用Keras开发用于Python序列分类的双向LSTM
- 如何开发Keras序列到序列预测的编码器 - 解码器模型
- 如何诊断LSTM模型的过度拟合和欠拟合
- 如何开发一种编码器 - 解码器模型,注重Keras中的序列到序列预测
- 编码器 - 解码器长短期存储器网络
- 神经网络中爆炸梯度的温和介绍
- 对时间反向传播的温和介绍
- 生成长短期记忆网络的温和介绍
- 专家对长短期记忆网络的简要介绍
- 在序列预测问题上充分利用LSTM
- 编辑器 - 解码器循环神经网络全局注意的温和介绍
- 如何利用长短时记忆循环神经网络处理很长的序列
- 如何在Python中对一个热编码序列数据
- 如何使用编码器 - 解码器LSTM来回显随机整数序列
- 具有注意力的编码器 - 解码器RNN体系结构的实现模式
- 学习使用编码器解码器LSTM循环神经网络添加数字
- 如何学习长短时记忆循环神经网络回声随机整数
- 具有Keras的长短期记忆循环神经网络的迷你课程
- LSTM自动编码器的温和介绍
- 如何用Keras中的长短期记忆模型进行预测
- 用Python中的长短期内存网络演示内存
- 基于循环神经网络的序列预测模型的简要介绍
- 深度学习的循环神经网络算法之旅
- 如何重塑Keras中长短期存储网络的输入数据
- 了解Keras中LSTM的返回序列和返回状态之间的差异
- RNN展开的温和介绍
- 5学习LSTM循环神经网络的简单序列预测问题的例子
- 使用序列进行预测
- 堆叠长短期内存网络
- 什么是教师强制循环神经网络?
- 如何在Python中使用TimeDistributed Layer for Long Short-Term Memory Networks
- 如何准备Keras中截断反向传播的序列预测
- 如何在使用LSTM进行训练和预测时使用不同的批量大小
- Machine Learning Mastery 机器学习算法教程
- 机器学习算法之旅
- 用于机器学习的装袋和随机森林集合算法
- 从头开始实施机器学习算法的好处
- 更好的朴素贝叶斯:从朴素贝叶斯算法中获取最多的12个技巧
- 机器学习的提升和AdaBoost
- 选择机器学习算法:Microsoft Azure的经验教训
- 机器学习的分类和回归树
- 什么是机器学习中的混淆矩阵
- 如何使用Python从头开始创建算法测试工具
- 通过创建机器学习算法的目标列表来控制
- 从头开始停止编码机器学习算法
- 在实现机器学习算法时,不要从开源代码开始
- 不要使用随机猜测作为基线分类器
- 浅谈机器学习中的概念漂移
- 温和介绍机器学习中的偏差 - 方差权衡
- 机器学习的梯度下降
- 机器学习算法如何工作(他们学习输入到输出的映射)
- 如何建立机器学习算法的直觉
- 如何实现机器学习算法
- 如何研究机器学习算法行为
- 如何学习机器学习算法
- 如何研究机器学习算法
- 如何研究机器学习算法
- 如何在Python中从头开始实现反向传播算法
- 如何用Python从头开始实现Bagging
- 如何用Python从头开始实现基线机器学习算法
- 如何在Python中从头开始实现决策树算法
- 如何用Python从头开始实现学习向量量化
- 如何利用Python从头开始随机梯度下降实现线性回归
- 如何利用Python从头开始随机梯度下降实现Logistic回归
- 如何用Python从头开始实现机器学习算法表现指标
- 如何在Python中从头开始实现感知器算法
- 如何在Python中从零开始实现随机森林
- 如何在Python中从头开始实现重采样方法
- 如何用Python从头开始实现简单线性回归
- 如何用Python从头开始实现堆栈泛化(Stacking)
- K-Nearest Neighbors for Machine Learning
- 学习机器学习的向量量化
- 机器学习的线性判别分析
- 机器学习的线性回归
- 使用梯度下降进行机器学习的线性回归教程
- 如何在Python中从头开始加载机器学习数据
- 机器学习的Logistic回归
- 机器学习的Logistic回归教程
- 机器学习算法迷你课程
- 如何在Python中从头开始实现朴素贝叶斯
- 朴素贝叶斯机器学习
- 朴素贝叶斯机器学习教程
- 机器学习算法的过拟合和欠拟合
- 参数化和非参数机器学习算法
- 理解任何机器学习算法的6个问题
- 在机器学习中拥抱随机性
- 如何使用Python从头开始扩展机器学习数据
- 机器学习的简单线性回归教程
- 有监督和无监督的机器学习算法
- 用于机器学习的支持向量机
- 在没有数学背景的情况下理解机器学习算法的5种技术
- 最好的机器学习算法
- 教程从头开始在Python中实现k-Nearest Neighbors
- 通过从零开始实现它们来理解机器学习算法(以及绕过坏代码的策略)
- 使用随机森林:在121个数据集上测试179个分类器
- 为什么从零开始实现机器学习算法
- Machine Learning Mastery 机器学习入门教程
- 机器学习入门的四个步骤:初学者入门与实践的自上而下策略
- 你应该培养的 5 个机器学习领域
- 一种选择机器学习算法的数据驱动方法
- 机器学习中的分析与数值解
- 应用机器学习是一种精英政治
- 机器学习的基本概念
- 如何成为数据科学家
- 初学者如何在机器学习中弄错
- 机器学习的最佳编程语言
- 构建机器学习组合
- 机器学习中分类与回归的区别
- 评估自己作为数据科学家并利用结果建立惊人的数据科学团队
- 探索 Kaggle 大师的方法论和心态:对 Diogo Ferreira 的采访
- 扩展机器学习工具并展示掌握
- 通过寻找地标开始机器学习
- 温和地介绍预测建模
- 通过提供结果在机器学习中获得梦想的工作
- 如何开始机器学习:自学蓝图
- 开始并在机器学习方面取得进展
- 应用机器学习的 Hello World
- 初学者如何使用小型项目开始机器学习并在 Kaggle 上进行竞争
- 我如何开始机器学习? (简短版)
- 我是如何开始机器学习的
- 如何在机器学习中取得更好的成绩
- 如何从在银行工作到担任 Target 的高级数据科学家
- 如何学习任何机器学习工具
- 使用小型目标项目深入了解机器学习工具
- 获得付费申请机器学习
- 映射机器学习工具的景观
- 机器学习开发环境
- 机器学习金钱
- 程序员的机器学习
- 机器学习很有意思
- 机器学习是 Kaggle 比赛
- 机器学习现在很受欢迎
- 机器学习掌握方法
- 机器学习很重要
- 机器学习 Q& A:概念漂移,更好的结果和学习更快
- 缺乏自学机器学习的路线图
- 机器学习很重要
- 快速了解任何机器学习工具(即使您是初学者)
- 机器学习工具
- 找到你的机器学习部落
- 机器学习在一年
- 通过竞争一致的大师 Kaggle
- 5 程序员在机器学习中开始犯错误
- 哲学毕业生到机器学习从业者(Brian Thomas 采访)
- 机器学习入门的实用建议
- 实用机器学习问题
- 使用来自 UCI 机器学习库的数据集练习机器学习
- 使用秘籍的任何机器学习工具快速启动
- 程序员可以进入机器学习
- 程序员应该进入机器学习
- 项目焦点:Shashank Singh 的人脸识别
- 项目焦点:使用 Mahout 和 Konstantin Slisenko 进行堆栈交换群集
- 机器学习自学指南
- 4 个自学机器学习项目
- ÁlvaroLemos 如何在数据科学团队中获得机器学习实习
- 如何思考机器学习
- 现实世界机器学习问题之旅
- 有关机器学习的有用知识
- 如果我没有学位怎么办?
- 如果我不是一个优秀的程序员怎么办?
- 如果我不擅长数学怎么办?
- 为什么机器学习算法会处理以前从未见过的数据?
- 是什么阻碍了你的机器学习目标?
- 什么是机器学习?
- 机器学习适合哪里?
- 为什么要进入机器学习?
- 研究对您来说很重要的机器学习问题
- 你这样做是错的。为什么机器学习不必如此困难
- Machine Learning Mastery Sklearn 教程
- Scikit-Learn 的温和介绍:Python 机器学习库
- 使用 Python 管道和 scikit-learn 自动化机器学习工作流程
- 如何以及何时使用带有 scikit-learn 的校准分类模型
- 如何比较 Python 中的机器学习算法与 scikit-learn
- 用于机器学习开发人员的 Python 崩溃课程
- 用 scikit-learn 在 Python 中集成机器学习算法
- 使用重采样评估 Python 中机器学习算法的表现
- 使用 Scikit-Learn 在 Python 中进行特征选择
- Python 中机器学习的特征选择
- 如何使用 scikit-learn 在 Python 中生成测试数据集
- scikit-learn 中的机器学习算法秘籍
- 如何使用 Python 处理丢失的数据
- 如何开始使用 Python 进行机器学习
- 如何使用 Scikit-Learn 在 Python 中加载数据
- Python 中概率评分方法的简要介绍
- 如何用 Scikit-Learn 调整算法参数
- 如何在 Mac OS X 上安装 Python 3 环境以进行机器学习和深度学习
- 使用 scikit-learn 进行机器学习简介
- 从 shell 到一本带有 Fernando Perez 单一工具的书的 IPython
- 如何使用 Python 3 为机器学习开发创建 Linux 虚拟机
- 如何在 Python 中加载机器学习数据
- 您在 Python 中的第一个机器学习项目循序渐进
- 如何使用 scikit-learn 进行预测
- 用于评估 Python 中机器学习算法的度量标准
- 使用 Pandas 为 Python 中的机器学习准备数据
- 如何使用 Scikit-Learn 为 Python 机器学习准备数据
- 项目焦点:使用 Artem Yankov 在 Python 中进行事件推荐
- 用于机器学习的 Python 生态系统
- Python 是应用机器学习的成长平台
- Python 机器学习书籍
- Python 机器学习迷你课程
- 使用 Pandas 快速和肮脏的数据分析
- 使用 Scikit-Learn 重新调整 Python 中的机器学习数据
- 如何以及何时使用 ROC 曲线和精确调用曲线进行 Python 分类
- 使用 scikit-learn 在 Python 中保存和加载机器学习模型
- scikit-learn Cookbook 书评
- 如何使用 Anaconda 为机器学习和深度学习设置 Python 环境
- 使用 scikit-learn 在 Python 中进行 Spot-Check 分类机器学习算法
- 如何在 Python 中开发可重复使用的抽样检查算法框架
- 使用 scikit-learn 在 Python 中进行 Spot-Check 回归机器学习算法
- 使用 Python 中的描述性统计来了解您的机器学习数据
- 使用 OpenCV,Python 和模板匹配来播放“哪里是 Waldo?”
- 使用 Pandas 在 Python 中可视化机器学习数据
- Machine Learning Mastery 统计学教程
- 浅谈计算正态汇总统计量
- 非参数统计的温和介绍
- Python中常态测试的温和介绍
- 浅谈Bootstrap方法
- 浅谈机器学习的中心极限定理
- 浅谈机器学习中的大数定律
- 机器学习的所有统计数据
- 如何计算Python中机器学习结果的Bootstrap置信区间
- 浅谈机器学习的Chi-Squared测试
- 机器学习的置信区间
- 随机化在机器学习中解决混杂变量的作用
- 机器学习中的受控实验
- 机器学习统计学速成班
- 统计假设检验的关键值以及如何在Python中计算它们
- 如何在机器学习中谈论数据(统计学和计算机科学术语)
- Python中数据可视化方法的简要介绍
- Python中效果大小度量的温和介绍
- 估计随机机器学习算法的实验重复次数
- 机器学习评估统计的温和介绍
- 如何计算Python中的非参数秩相关性
- 如何在Python中计算数据的5位数摘要
- 如何在Python中从头开始编写学生t检验
- 如何在Python中生成随机数
- 如何转换数据以更好地拟合正态分布
- 如何使用相关来理解变量之间的关系
- 如何使用统计信息识别数据中的异常值
- 用于Python机器学习的随机数生成器简介
- k-fold交叉验证的温和介绍
- 如何计算McNemar的比较两种机器学习量词的测试
- Python中非参数统计显着性测试简介
- 如何在Python中使用参数统计显着性测试
- 机器学习的预测间隔
- 应用统计学与机器学习的密切关系
- 如何使用置信区间报告分类器表现
- 统计数据分布的简要介绍
- 15 Python中的统计假设检验(备忘单)
- 统计假设检验的温和介绍
- 10如何在机器学习项目中使用统计方法的示例
- Python中统计功效和功耗分析的简要介绍
- 统计抽样和重新抽样的简要介绍
- 比较机器学习算法的统计显着性检验
- 机器学习中统计容差区间的温和介绍
- 机器学习统计书籍
- 评估机器学习模型的统计数据
- 机器学习统计(7天迷你课程)
- 用于机器学习的简明英语统计
- 如何使用统计显着性检验来解释机器学习结果
- 什么是统计(为什么它在机器学习中很重要)?
- Machine Learning Mastery 时间序列入门教程
- 如何在 Python 中为时间序列预测创建 ARIMA 模型
- 用 Python 进行时间序列预测的自回归模型
- 如何回溯机器学习模型的时间序列预测
- Python 中基于时间序列数据的基本特征工程
- R 的时间序列预测热门书籍
- 10 挑战机器学习时间序列预测问题
- 如何将时间序列转换为 Python 中的监督学习问题
- 如何将时间序列数据分解为趋势和季节性
- 如何用 ARCH 和 GARCH 模拟波动率进行时间序列预测
- 如何将时间序列数据集与 Python 区分开来
- Python 中时间序列预测的指数平滑的温和介绍
- 用 Python 进行时间序列预测的特征选择
- 浅谈自相关和部分自相关
- 时间序列预测的 Box-Jenkins 方法简介
- 用 Python 简要介绍时间序列的时间序列预测
- 如何使用 Python 网格搜索 ARIMA 模型超参数
- 如何在 Python 中加载和探索时间序列数据
- 如何使用 Python 对 ARIMA 模型进行手动预测
- 如何用 Python 进行时间序列预测的预测
- 如何使用 Python 中的 ARIMA 进行样本外预测
- 如何利用 Python 模拟残差错误来纠正时间序列预测
- 使用 Python 进行数据准备,特征工程和时间序列预测的移动平均平滑
- 多步时间序列预测的 4 种策略
- 如何在 Python 中规范化和标准化时间序列数据
- 如何利用 Python 进行时间序列预测的基线预测
- 如何使用 Python 对时间序列预测数据进行功率变换
- 用于时间序列预测的 Python 环境
- 如何重构时间序列预测问题
- 如何使用 Python 重新采样和插值您的时间序列数据
- 用 Python 编写 SARIMA 时间序列预测
- 如何在 Python 中保存 ARIMA 时间序列预测模型
- 使用 Python 进行季节性持久性预测
- 基于 ARIMA 的 Python 历史规模敏感性预测技巧分析
- 简单的时间序列预测模型进行测试,这样你就不会欺骗自己
- 标准多变量,多步骤和多站点时间序列预测问题
- 如何使用 Python 检查时间序列数据是否是固定的
- 使用 Python 进行时间序列数据可视化
- 7 个机器学习的时间序列数据集
- 时间序列预测案例研究与 Python:波士顿每月武装抢劫案
- Python 的时间序列预测案例研究:巴尔的摩的年度用水量
- 使用 Python 进行时间序列预测研究:法国香槟的月销售额
- 使用 Python 的置信区间理解时间序列预测不确定性
- 11 Python 中的经典时间序列预测方法(备忘单)
- 使用 Python 进行时间序列预测表现测量
- 使用 Python 7 天迷你课程进行时间序列预测
- 时间序列预测作为监督学习
- 什么是时间序列预测?
- 如何使用 Python 识别和删除时间序列数据的季节性
- 如何在 Python 中使用和删除时间序列数据中的趋势信息
- 如何在 Python 中调整 ARIMA 参数
- 如何用 Python 可视化时间序列残差预测错误
- 白噪声时间序列与 Python
- 如何通过时间序列预测项目
- Machine Learning Mastery XGBoost 教程
- 通过在 Python 中使用 XGBoost 提前停止来避免过度拟合
- 如何在 Python 中调优 XGBoost 的多线程支持
- 如何配置梯度提升算法
- 在 Python 中使用 XGBoost 进行梯度提升的数据准备
- 如何使用 scikit-learn 在 Python 中开发您的第一个 XGBoost 模型
- 如何在 Python 中使用 XGBoost 评估梯度提升模型
- 在 Python 中使用 XGBoost 的特征重要性和特征选择
- 浅谈机器学习的梯度提升算法
- 应用机器学习的 XGBoost 简介
- 如何在 macOS 上为 Python 安装 XGBoost
- 如何在 Python 中使用 XGBoost 保存梯度提升模型
- 从梯度提升开始,比较 165 个数据集上的 13 种算法
- 在 Python 中使用 XGBoost 和 scikit-learn 进行随机梯度提升
- 如何使用 Amazon Web Services 在云中训练 XGBoost 模型
- 在 Python 中使用 XGBoost 调整梯度提升的学习率
- 如何在 Python 中使用 XGBoost 调整决策树的数量和大小
- 如何在 Python 中使用 XGBoost 可视化梯度提升决策树
- 在 Python 中开始使用 XGBoost 的 7 步迷你课程
