# 使用 Python 进行季节性持久性预测
> 原文: [https://machinelearningmastery.com/seasonal-persistence-forecasting-python/](https://machinelearningmastery.com/seasonal-persistence-forecasting-python/)
通常使用[持久性或朴素预测](http://machinelearningmastery.com/persistence-time-series-forecasting-with-python/)作为时间序列问题的首次预测。
对具有季节性成分的时间序列数据进行更好的首次预测是在上一季中同时持续观察。这称为季节性持久性。
在本教程中,您将了解如何在 Python 中实现时间序列预测的季节性持久性。
完成本教程后,您将了解:
* 如何使用前几季的点观察来进行持久性预测。
* 如何在前一季的滑动窗口中使用平均观测值来进行持久性预测。
* 如何应用和评估每月和每日时间序列数据的季节性持久性。
让我们开始吧。
## 季节性持久性
在转向更复杂的方法之前,对时间序列问题进行有用的首次预测至关重要,以提供较低的技能。
这是为了确保我们不会在不具有预测性的模型或数据集上浪费时间。
在时间序列预测时,通常使用持久性或朴素预测作为首次预测模型。
对于具有明显季节性成分的时间序列数据,这没有意义。对于季节性数据,更好的第一次切割模型是在前一季节周期中同时使用观察作为预测。
我们可以称之为“_ 季节性持久性 _”,它是一个简单的模型,可以产生有效的第一次切割模型。
更好的一步是在之前的季节周期中同时使用最后几个观测值的简单函数。例如,观察的平均值。这通常可以提供一些额外的好处。
在本教程中,我们将演示这种简单的季节性持久性预测方法,用于在三个不同的真实时间序列数据集上提供预测技能的下限。
## 滑动窗的季节性持久性
在本教程中,我们将使用滑动窗口季节性持久性模型进行预测。
在滑动窗口内,将收集前一年季节中同时的观测结果,这些观测结果的平均值可用作持续预测。
可以评估不同的窗口大小以找到最小化错误的组合。
例如,如果数据是每月且预测的月份是 2 月,那么使用大小为 1 的窗口( _w = 1_ ),将使用去年 2 月的观察值来进行预测。
一个大小为 2 的窗口( _w = 2_ )将涉及对最后两个 Februaries 进行平均观察并用作预测。
另一种解释可能寻求使用前几年的点观测值(例如每月数据的 t-12,t-24 等),而不是采用累积点观测值的平均值。也许在您的数据集上尝试两种方法,看看哪种方法最适合作为一个好的起点模型。
## 实验测试线束
一致地评估时间序列预测模型非常重要。
在本节中,我们将定义如何在本教程中评估预测模型。
首先,我们将保留最近两年的数据,并评估对这些数据的预测。这适用于我们将查看的每月和每日数据。
我们将使用前向验证来评估模型表现。这意味着将枚举测试数据集中的每个时间步,在历史数据上构建模型,并将预测与预期值进行比较。然后将观察结果添加到训练数据集中并重复该过程。
前瞻性验证是评估时间序列预测模型的现实方法,因为人们可以期望在新观察结果可用时更新模型。
最后,将使用均方根误差或 RMSE 来评估预测。 RMSE 的好处在于它会对大错误进行处罚,并且得分与预测值(每月汽车销售额)的单位相同。
总之,测试工具包括:
* 最近 2 年的数据用作测试集。
* 模型评估的前瞻性验证。
* 用于报告模型技能的均方根误差。
## 案例研究 1:每月汽车销售数据集
月度汽车销售数据集描述了 1960 年至 1968 年间加拿大魁北克省的汽车销售数量。
单位是销售数量的计数,有 108 个观察值。数据来源归功于 Abraham 和 Ledolter(1983)。
[您可以从 DataMarket](https://datamarket.com/data/set/22n4/monthly-car-sales-in-quebec-1960-1968) 下载数据集。
下载数据集并将其保存到当前工作目录中,文件名为“ _car-sales.csv_ ”。请注意,您可能需要从文件中删除页脚信息。
下面的代码将数据集加载为 Pandas Series 对象。
```py
# line plot of time series
from pandas import Series
from matplotlib import pyplot
# load dataset
series = Series.from_csv('car-sales.csv', header=0)
# display first few rows
print(series.head(5))
# line plot of dataset
series.plot()
pyplot.show()
```
运行该示例将打印前 5 行数据。
```py
Month
1960-01-01 6550
1960-02-01 8728
1960-03-01 12026
1960-04-01 14395
1960-05-01 14587
Name: Sales, dtype: int64
```
还提供了数据的线图。我们可以看到年度季节性成分和增长趋势。
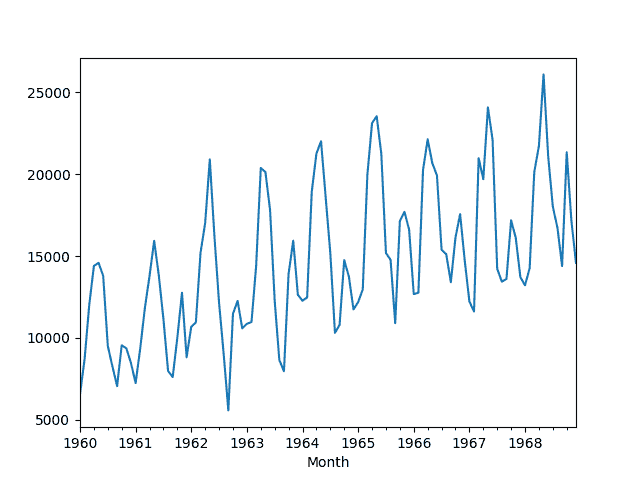
月度汽车销售数据集的线图
之前 24 个月的数据将作为测试数据保留。我们将用 1 至 5 年的滑动窗口调查季节性持久性。
下面列出了完整的示例。
```py
from pandas import Series
from sklearn.metrics import mean_squared_error
from math import sqrt
from numpy import mean
from matplotlib import pyplot
# load data
series = Series.from_csv('car-sales.csv', header=0)
# prepare data
X = series.values
train, test = X[0:-24], X[-24:]
# evaluate mean of different number of years
years = [1, 2, 3, 4, 5]
scores = list()
for year in years:
# walk-forward validation
history = [x for x in train]
predictions = list()
for i in range(len(test)):
# collect obs
obs = list()
for y in range(1, year+1):
obs.append(history[-(y*12)])
# make prediction
yhat = mean(obs)
predictions.append(yhat)
# observation
history.append(test[i])
# report performance
rmse = sqrt(mean_squared_error(test, predictions))
scores.append(rmse)
print('Years=%d, RMSE: %.3f' % (year, rmse))
pyplot.plot(years, scores)
pyplot.show()
```
运行该示例从前几年同一月的观察滑动窗口打印年份数和平均观测值的 RMSE。
结果表明,采用过去三年的平均值是一个良好的起始模型,汽车销售的 RMSE 为 1803.630。
```py
Years=1, RMSE: 1997.732
Years=2, RMSE: 1914.911
Years=3, RMSE: 1803.630
Years=4, RMSE: 2099.481
Years=5, RMSE: 2522.235
```
创建滑动窗口大小与模型错误的关系图。
该图很好地显示了滑动窗口大小为 3 年的改进,然后是从那一点开始的误差的快速增加。
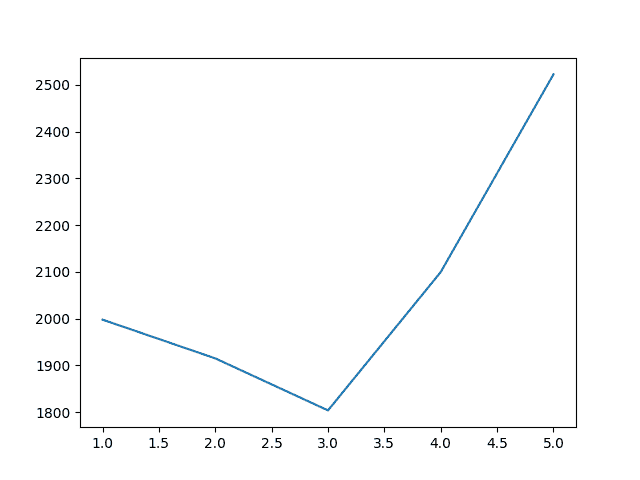
每月汽车销售的窗口大小滑动到 RMSE
## 案例研究 2:每月书面纸销售数据集
每月书写纸销售数据集描述了专业书写纸销售的数量。
单位是销售数量的一种类型,有 147 个月的观察(仅超过 12 年)。计数是分数,表明数据实际上可能以数十万销售为单位。数据来源归功于 Makridakis 和 Wheelwright(1989)。
[您可以从 DataMarket](https://datamarket.com/data/set/22sc/cfe-specialty-writing-papers-monthly-sales) 下载数据集。
下载数据集并将其保存到当前工作目录中,文件名为“ _writing-paper-sales.csv_ ”。请注意,您可能需要从文件中删除页脚信息。
日期时间戳仅包含年份编号和月份。因此,需要自定义日期时间解析功能来加载数据并将数据基于任意年份。选择 1900 年作为起点,这不应影响本案例研究。
下面的示例将每月书写纸销售数据集加载为 Pandas 系列。
```py
# load and plot dataset
from pandas import read_csv
from pandas import datetime
from matplotlib import pyplot
# load dataset
def parser(x):
if len(x) == 4:
return datetime.strptime('190'+x, '%Y-%m')
return datetime.strptime('19'+x, '%Y-%m')
series = read_csv('writing-paper-sales.csv', header=0, parse_dates=[0], index_col=0, squeeze=True, date_parser=parser)
# summarize first few rows
print(series.head())
# line plot
series.plot()
pyplot.show()
```
运行该示例将打印已加载数据集的前 5 行。
```py
Month
1901-01-01 1359.795
1901-02-01 1278.564
1901-03-01 1508.327
1901-04-01 1419.710
1901-05-01 1440.510
```
然后创建加载的数据集的线图。我们可以看到年度季节性成分和增长趋势。
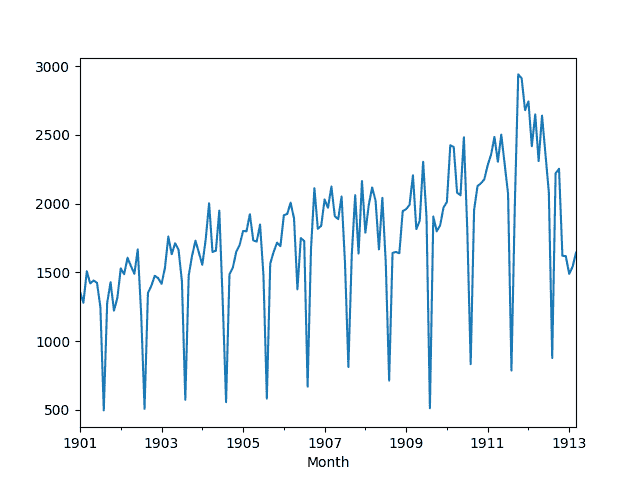
月刊书写纸销售数据集的线图
与前面的示例一样,我们可以将最近 24 个月的观察结果作为测试数据集。因为我们有更多的数据,我们将尝试从 1 年到 10 年的滑动窗口大小。
下面列出了完整的示例。
```py
from pandas import read_csv
from pandas import datetime
from sklearn.metrics import mean_squared_error
from math import sqrt
from numpy import mean
from matplotlib import pyplot
# load dataset
def parser(x):
if len(x) == 4:
return datetime.strptime('190'+x, '%Y-%m')
return datetime.strptime('19'+x, '%Y-%m')
series = read_csv('writing-paper-sales.csv', header=0, parse_dates=[0], index_col=0, squeeze=True, date_parser=parser)
# prepare data
X = series.values
train, test = X[0:-24], X[-24:]
# evaluate mean of different number of years
years = [1, 2, 3, 4, 5, 6, 7, 8, 9, 10]
scores = list()
for year in years:
# walk-forward validation
history = [x for x in train]
predictions = list()
for i in range(len(test)):
# collect obs
obs = list()
for y in range(1, year+1):
obs.append(history[-(y*12)])
# make prediction
yhat = mean(obs)
predictions.append(yhat)
# observation
history.append(test[i])
# report performance
rmse = sqrt(mean_squared_error(test, predictions))
scores.append(rmse)
print('Years=%d, RMSE: %.3f' % (year, rmse))
pyplot.plot(years, scores)
pyplot.show()
```
运行该示例将打印滑动窗口的大小以及由此产生的季节性持久性模型错误。
结果表明,窗户大小为 5 年是最佳的,每月写作纸的 RMSE 为 554.660。
```py
Years=1, RMSE: 606.089
Years=2, RMSE: 557.653
Years=3, RMSE: 555.777
Years=4, RMSE: 544.251
Years=5, RMSE: 540.317
Years=6, RMSE: 554.660
Years=7, RMSE: 569.032
Years=8, RMSE: 581.405
Years=9, RMSE: 602.279
Years=10, RMSE: 624.756
```
窗口大小和错误之间的关系在线图上绘制,显示与前一场景相似的错误趋势。错误在再次增加之前下降到拐点(在这种情况下为 5 年)。
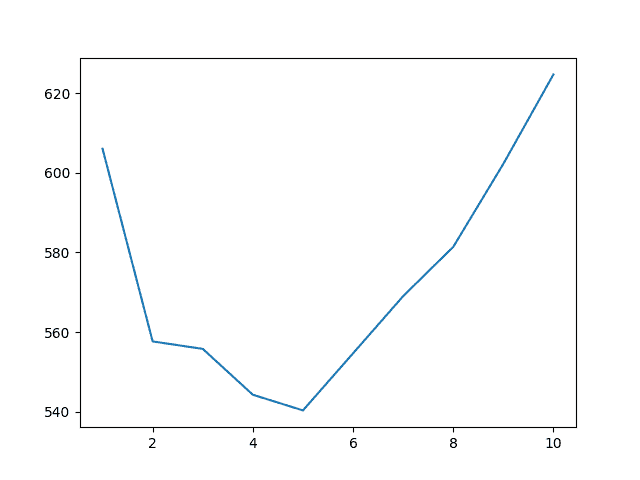
每月书写纸销售的窗口大小滑动到 RMSE
## 案例研究 3:墨尔本每日最高温度数据集
每日最高墨尔本气温数据集描述了 1981 年至 1990 年期间澳大利亚墨尔本市的日常气温。
单位是摄氏度,有 3,650 个观测值,或 10 年的数据。数据来源记入澳大利亚气象局。
[您可以从 DataMarket](https://datamarket.com/data/set/2323/daily-maximum-temperatures-in-melbourne-australia-1981-1990) 下载数据集。
下载数据集并将其保存到当前工作目录中,文件名为“ _max-daily-temps.csv_ ”。请注意,您可能需要从文件中删除页脚信息。
下面的示例演示如何将数据集加载为 Pandas 系列。
```py
# line plot of time series
from pandas import Series
from matplotlib import pyplot
# load dataset
series = Series.from_csv('max-daily-temps.csv', header=0)
# display first few rows
print(series.head(5))
# line plot of dataset
series.plot()
pyplot.show()
```
运行该示例将打印前 5 行数据。
```py
Date
1981-01-01 38.1
1981-01-02 32.4
1981-01-03 34.5
1981-01-04 20.7
1981-01-05 21.5
```
还创建了线图。我们可以看到,我们比前两个场景有更多的观察,并且数据中存在明显的季节性趋势。
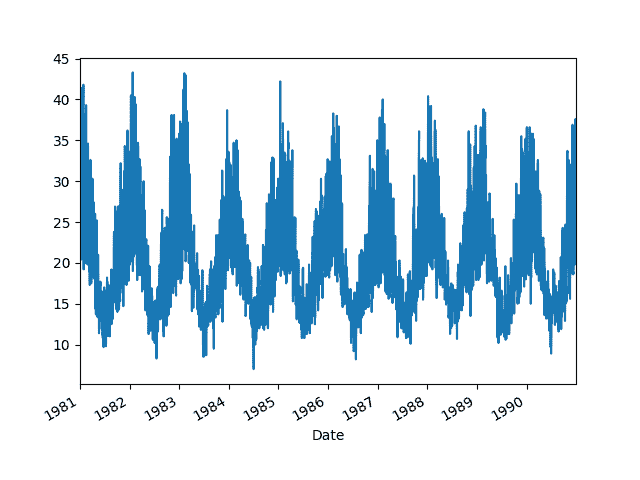
每日墨尔本最高温度数据集的线图
由于数据是每天,我们需要将测试数据中的年份指定为 365 天而不是 12 个月的函数。
这忽略了闰年,这是一个可能,甚至应该在您自己的项目中解决的复杂问题。
下面列出了季节性持久性的完整示例。
```py
from pandas import Series
from sklearn.metrics import mean_squared_error
from math import sqrt
from numpy import mean
from matplotlib import pyplot
# load data
series = Series.from_csv('max-daily-temps.csv', header=0)
# prepare data
X = series.values
train, test = X[0:-(2*365)], X[-(2*365):]
# evaluate mean of different number of years
years = [1, 2, 3, 4, 5, 6, 7, 8]
scores = list()
for year in years:
# walk-forward validation
history = [x for x in train]
predictions = list()
for i in range(len(test)):
# collect obs
obs = list()
for y in range(1, year+1):
obs.append(history[-(y*365)])
# make prediction
yhat = mean(obs)
predictions.append(yhat)
# observation
history.append(test[i])
# report performance
rmse = sqrt(mean_squared_error(test, predictions))
scores.append(rmse)
print('Years=%d, RMSE: %.3f' % (year, rmse))
pyplot.plot(years, scores)
pyplot.show()
```
运行该示例将打印滑动窗口的大小和相应的模型错误。
与前两种情况不同,我们可以看到随着窗口大小的增加技能不断提高的趋势。
最好的结果是所有 8 年历史数据的滑动窗口,RMSE 为 4.271。
```py
Years=1, RMSE: 5.950
Years=2, RMSE: 5.083
Years=3, RMSE: 4.664
Years=4, RMSE: 4.539
Years=5, RMSE: 4.448
Years=6, RMSE: 4.358
Years=7, RMSE: 4.371
Years=8, RMSE: 4.271
```
滑动窗口大小与模型误差的关系图使这一趋势明显。
它表明,如果最优模型证明是前几年同一天的观测函数,那么获得更多这个问题的历史数据可能会有用。
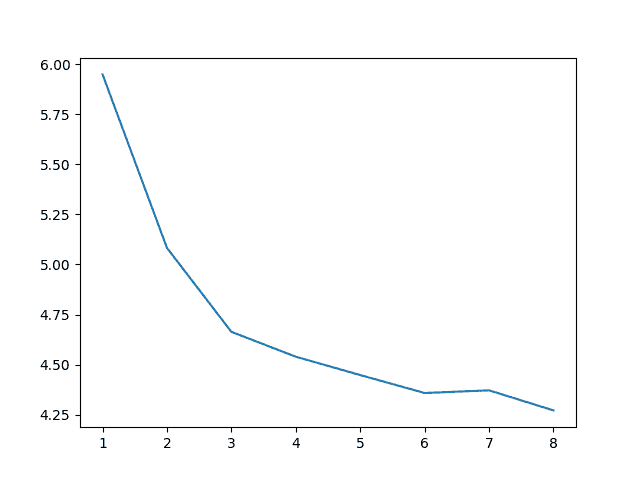
将窗口尺寸滑动到 RMSE 以获得每日墨尔本最高温度
如果观察结果是在前几季的同一周或一个月中取平均值,我们也可以这样做,这可能是一个富有成果的实验。
## 摘要
在本教程中,您发现了时间序列预测的季节性持久性。
你了解到:
* 如何使用前几季的点观察来进行持久性预测。
* 如何在多个前几季使用滑动窗口的平均值来进行持久性预测。
* 如何将季节性持久性应用于每日和每月时间序列数据。
您对季节性数据的持久性有任何疑问吗?
在评论中提出您的问题,我会尽力回答。
- Machine Learning Mastery 应用机器学习教程
- 5竞争机器学习的好处
- 过度拟合的简单直觉,或者为什么测试训练数据是一个坏主意
- 特征选择简介
- 应用机器学习作为一个搜索问题的温和介绍
- 为什么应用机器学习很难
- 为什么我的结果不如我想的那么好?你可能过度拟合了
- 用ROC曲线评估和比较分类器表现
- BigML评论:发现本机学习即服务平台的聪明功能
- BigML教程:开发您的第一个决策树并进行预测
- 构建生产机器学习基础设施
- 分类准确性不够:可以使用更多表现测量
- 一种预测模型的巧妙应用
- 机器学习项目中常见的陷阱
- 数据清理:将凌乱的数据转换为整洁的数据
- 机器学习中的数据泄漏
- 数据,学习和建模
- 数据管理至关重要以及为什么需要认真对待它
- 将预测模型部署到生产中
- 参数和超参数之间有什么区别?
- 测试和验证数据集之间有什么区别?
- 发现特征工程,如何设计特征以及如何获得它
- 如何开始使用Kaggle
- 超越预测
- 如何在评估机器学习算法时选择正确的测试选项
- 如何定义机器学习问题
- 如何评估机器学习算法
- 如何获得基线结果及其重要性
- 如何充分利用机器学习数据
- 如何识别数据中的异常值
- 如何提高机器学习效果
- 如何在竞争机器学习中踢屁股
- 如何知道您的机器学习模型是否具有良好的表现
- 如何布局和管理您的机器学习项目
- 如何为机器学习准备数据
- 如何减少最终机器学习模型中的方差
- 如何使用机器学习结果
- 如何解决像数据科学家这样的问题
- 通过数据预处理提高模型精度
- 处理机器学习的大数据文件的7种方法
- 建立机器学习系统的经验教训
- 如何使用机器学习清单可靠地获得准确的预测(即使您是初学者)
- 机器学习模型运行期间要做什么
- 机器学习表现改进备忘单
- 来自世界级从业者的机器学习技巧:Phil Brierley
- 模型预测精度与机器学习中的解释
- 竞争机器学习的模型选择技巧
- 机器学习需要多少训练数据?
- 如何系统地规划和运行机器学习实验
- 应用机器学习过程
- 默认情况下可重现的机器学习结果
- 10个实践应用机器学习的标准数据集
- 简单的三步法到最佳机器学习算法
- 打击机器学习数据集中不平衡类的8种策略
- 模型表现不匹配问题(以及如何处理)
- 黑箱机器学习的诱惑陷阱
- 如何培养最终的机器学习模型
- 使用探索性数据分析了解您的问题并获得更好的结果
- 什么是数据挖掘和KDD
- 为什么One-Hot在机器学习中编码数据?
- 为什么你应该在你的机器学习问题上进行抽样检查算法
- 所以,你正在研究机器学习问题......
- Machine Learning Mastery Keras 深度学习教程
- Keras 中神经网络模型的 5 步生命周期
- 在 Python 迷你课程中应用深度学习
- Keras 深度学习库的二元分类教程
- 如何用 Keras 构建多层感知器神经网络模型
- 如何在 Keras 中检查深度学习模型
- 10 个用于 Amazon Web Services 深度学习的命令行秘籍
- 机器学习卷积神经网络的速成课程
- 如何在 Python 中使用 Keras 进行深度学习的度量
- 深度学习书籍
- 深度学习课程
- 你所知道的深度学习是一种谎言
- 如何设置 Amazon AWS EC2 GPU 以训练 Keras 深度学习模型(分步)
- 神经网络中批量和迭代之间的区别是什么?
- 在 Keras 展示深度学习模型训练历史
- 基于 Keras 的深度学习模型中的dropout正则化
- 评估 Keras 中深度学习模型的表现
- 如何评价深度学习模型的技巧
- 小批量梯度下降的简要介绍以及如何配置批量大小
- 在 Keras 中获得深度学习帮助的 9 种方法
- 如何使用 Keras 在 Python 中网格搜索深度学习模型的超参数
- 用 Keras 在 Python 中使用卷积神经网络进行手写数字识别
- 如何用 Keras 进行预测
- 用 Keras 进行深度学习的图像增强
- 8 个深度学习的鼓舞人心的应用
- Python 深度学习库 Keras 简介
- Python 深度学习库 TensorFlow 简介
- Python 深度学习库 Theano 简介
- 如何使用 Keras 函数式 API 进行深度学习
- Keras 深度学习库的多类分类教程
- 多层感知器神经网络速成课程
- 基于卷积神经网络的 Keras 深度学习库中的目标识别
- 流行的深度学习库
- 用深度学习预测电影评论的情感
- Python 中的 Keras 深度学习库的回归教程
- 如何使用 Keras 获得可重现的结果
- 如何在 Linux 服务器上运行深度学习实验
- 保存并加载您的 Keras 深度学习模型
- 用 Keras 逐步开发 Python 中的第一个神经网络
- 用 Keras 理解 Python 中的有状态 LSTM 循环神经网络
- 在 Python 中使用 Keras 深度学习模型和 Scikit-Learn
- 如何使用预训练的 VGG 模型对照片中的物体进行分类
- 在 Python 和 Keras 中对深度学习模型使用学习率调度
- 如何在 Keras 中可视化深度学习神经网络模型
- 什么是深度学习?
- 何时使用 MLP,CNN 和 RNN 神经网络
- 为什么用随机权重初始化神经网络?
- Machine Learning Mastery 深度学习 NLP 教程
- 深度学习在自然语言处理中的 7 个应用
- 如何实现自然语言处理的波束搜索解码器
- 深度学习文档分类的最佳实践
- 关于自然语言处理的热门书籍
- 在 Python 中计算文本 BLEU 分数的温和介绍
- 使用编码器 - 解码器模型的用于字幕生成的注入和合并架构
- 如何用 Python 清理机器学习的文本
- 如何配置神经机器翻译的编码器 - 解码器模型
- 如何开始深度学习自然语言处理(7 天迷你课程)
- 自然语言处理的数据集
- 如何开发一种深度学习的词袋模型来预测电影评论情感
- 深度学习字幕生成模型的温和介绍
- 如何在 Keras 中定义神经机器翻译的编码器 - 解码器序列 - 序列模型
- 如何利用小实验在 Keras 中开发字幕生成模型
- 如何从头开发深度学习图片标题生成器
- 如何在 Keras 中开发基于字符的神经语言模型
- 如何开发用于情感分析的 N-gram 多通道卷积神经网络
- 如何从零开始开发神经机器翻译系统
- 如何在 Python 中用 Keras 开发基于单词的神经语言模型
- 如何开发一种预测电影评论情感的词嵌入模型
- 如何使用 Gensim 在 Python 中开发词嵌入
- 用于文本摘要的编码器 - 解码器深度学习模型
- Keras 中文本摘要的编码器 - 解码器模型
- 用于神经机器翻译的编码器 - 解码器循环神经网络模型
- 浅谈词袋模型
- 文本摘要的温和介绍
- 编码器 - 解码器循环神经网络中的注意力如何工作
- 如何利用深度学习自动生成照片的文本描述
- 如何开发一个单词级神经语言模型并用它来生成文本
- 浅谈神经机器翻译
- 什么是自然语言处理?
- 牛津自然语言处理深度学习课程
- 如何为机器翻译准备法语到英语的数据集
- 如何为情感分析准备电影评论数据
- 如何为文本摘要准备新闻文章
- 如何准备照片标题数据集以训练深度学习模型
- 如何使用 Keras 为深度学习准备文本数据
- 如何使用 scikit-learn 为机器学习准备文本数据
- 自然语言处理神经网络模型入门
- 对自然语言处理的深度学习的承诺
- 在 Python 中用 Keras 进行 LSTM 循环神经网络的序列分类
- 斯坦福自然语言处理深度学习课程评价
- 统计语言建模和神经语言模型的简要介绍
- 使用 Keras 在 Python 中进行 LSTM 循环神经网络的文本生成
- 浅谈机器学习中的转换
- 如何使用 Keras 将词嵌入层用于深度学习
- 什么是用于文本的词嵌入
- Machine Learning Mastery 深度学习时间序列教程
- 如何开发人类活动识别的一维卷积神经网络模型
- 人类活动识别的深度学习模型
- 如何评估人类活动识别的机器学习算法
- 时间序列预测的多层感知器网络探索性配置
- 比较经典和机器学习方法进行时间序列预测的结果
- 如何通过深度学习快速获得时间序列预测的结果
- 如何利用 Python 处理序列预测问题中的缺失时间步长
- 如何建立预测大气污染日的概率预测模型
- 如何开发一种熟练的机器学习时间序列预测模型
- 如何构建家庭用电自回归预测模型
- 如何开发多步空气污染时间序列预测的自回归预测模型
- 如何制定多站点多元空气污染时间序列预测的基线预测
- 如何开发时间序列预测的卷积神经网络模型
- 如何开发卷积神经网络用于多步时间序列预测
- 如何开发单变量时间序列预测的深度学习模型
- 如何开发 LSTM 模型用于家庭用电的多步时间序列预测
- 如何开发 LSTM 模型进行时间序列预测
- 如何开发多元多步空气污染时间序列预测的机器学习模型
- 如何开发多层感知器模型进行时间序列预测
- 如何开发人类活动识别时间序列分类的 RNN 模型
- 如何开始深度学习的时间序列预测(7 天迷你课程)
- 如何网格搜索深度学习模型进行时间序列预测
- 如何对单变量时间序列预测的网格搜索朴素方法
- 如何在 Python 中搜索 SARIMA 模型超参数用于时间序列预测
- 如何在 Python 中进行时间序列预测的网格搜索三次指数平滑
- 一个标准的人类活动识别问题的温和介绍
- 如何加载和探索家庭用电数据
- 如何加载,可视化和探索复杂的多变量多步时间序列预测数据集
- 如何从智能手机数据模拟人类活动
- 如何根据环境因素预测房间占用率
- 如何使用脑波预测人眼是开放还是闭合
- 如何在 Python 中扩展长短期内存网络的数据
- 如何使用 TimeseriesGenerator 进行 Keras 中的时间序列预测
- 基于机器学习算法的室内运动时间序列分类
- 用于时间序列预测的状态 LSTM 在线学习的不稳定性
- 用于罕见事件时间序列预测的 LSTM 模型体系结构
- 用于时间序列预测的 4 种通用机器学习数据变换
- Python 中长短期记忆网络的多步时间序列预测
- 家庭用电机器学习的多步时间序列预测
- Keras 中 LSTM 的多变量时间序列预测
- 如何开发和评估朴素的家庭用电量预测方法
- 如何为长短期记忆网络准备单变量时间序列数据
- 循环神经网络在时间序列预测中的应用
- 如何在 Python 中使用差异变换删除趋势和季节性
- 如何在 LSTM 中种子状态用于 Python 中的时间序列预测
- 使用 Python 进行时间序列预测的有状态和无状态 LSTM
- 长短时记忆网络在时间序列预测中的适用性
- 时间序列预测问题的分类
- Python 中长短期记忆网络的时间序列预测
- 基于 Keras 的 Python 中 LSTM 循环神经网络的时间序列预测
- Keras 中深度学习的时间序列预测
- 如何用 Keras 调整 LSTM 超参数进行时间序列预测
- 如何在时间序列预测训练期间更新 LSTM 网络
- 如何使用 LSTM 网络的 Dropout 进行时间序列预测
- 如何使用 LSTM 网络中的特征进行时间序列预测
- 如何在 LSTM 网络中使用时间序列进行时间序列预测
- 如何利用 LSTM 网络进行权重正则化进行时间序列预测
- Machine Learning Mastery 线性代数教程
- 机器学习数学符号的基础知识
- 用 NumPy 阵列轻松介绍广播
- 如何从 Python 中的 Scratch 计算主成分分析(PCA)
- 用于编码器审查的计算线性代数
- 10 机器学习中的线性代数示例
- 线性代数的温和介绍
- 用 NumPy 轻松介绍 Python 中的 N 维数组
- 机器学习向量的温和介绍
- 如何在 Python 中为机器学习索引,切片和重塑 NumPy 数组
- 机器学习的矩阵和矩阵算法简介
- 温和地介绍机器学习的特征分解,特征值和特征向量
- NumPy 对预期价值,方差和协方差的简要介绍
- 机器学习矩阵分解的温和介绍
- 用 NumPy 轻松介绍机器学习的张量
- 用于机器学习的线性代数中的矩阵类型简介
- 用于机器学习的线性代数备忘单
- 线性代数的深度学习
- 用于机器学习的线性代数(7 天迷你课程)
- 机器学习的线性代数
- 机器学习矩阵运算的温和介绍
- 线性代数评论没有废话指南
- 学习机器学习线性代数的主要资源
- 浅谈机器学习的奇异值分解
- 如何用线性代数求解线性回归
- 用于机器学习的稀疏矩阵的温和介绍
- 机器学习中向量规范的温和介绍
- 学习线性代数用于机器学习的 5 个理由
- Machine Learning Mastery LSTM 教程
- Keras中长短期记忆模型的5步生命周期
- 长短时记忆循环神经网络的注意事项
- CNN长短期记忆网络
- 逆向神经网络中的深度学习速成课程
- 可变长度输入序列的数据准备
- 如何用Keras开发用于Python序列分类的双向LSTM
- 如何开发Keras序列到序列预测的编码器 - 解码器模型
- 如何诊断LSTM模型的过度拟合和欠拟合
- 如何开发一种编码器 - 解码器模型,注重Keras中的序列到序列预测
- 编码器 - 解码器长短期存储器网络
- 神经网络中爆炸梯度的温和介绍
- 对时间反向传播的温和介绍
- 生成长短期记忆网络的温和介绍
- 专家对长短期记忆网络的简要介绍
- 在序列预测问题上充分利用LSTM
- 编辑器 - 解码器循环神经网络全局注意的温和介绍
- 如何利用长短时记忆循环神经网络处理很长的序列
- 如何在Python中对一个热编码序列数据
- 如何使用编码器 - 解码器LSTM来回显随机整数序列
- 具有注意力的编码器 - 解码器RNN体系结构的实现模式
- 学习使用编码器解码器LSTM循环神经网络添加数字
- 如何学习长短时记忆循环神经网络回声随机整数
- 具有Keras的长短期记忆循环神经网络的迷你课程
- LSTM自动编码器的温和介绍
- 如何用Keras中的长短期记忆模型进行预测
- 用Python中的长短期内存网络演示内存
- 基于循环神经网络的序列预测模型的简要介绍
- 深度学习的循环神经网络算法之旅
- 如何重塑Keras中长短期存储网络的输入数据
- 了解Keras中LSTM的返回序列和返回状态之间的差异
- RNN展开的温和介绍
- 5学习LSTM循环神经网络的简单序列预测问题的例子
- 使用序列进行预测
- 堆叠长短期内存网络
- 什么是教师强制循环神经网络?
- 如何在Python中使用TimeDistributed Layer for Long Short-Term Memory Networks
- 如何准备Keras中截断反向传播的序列预测
- 如何在使用LSTM进行训练和预测时使用不同的批量大小
- Machine Learning Mastery 机器学习算法教程
- 机器学习算法之旅
- 用于机器学习的装袋和随机森林集合算法
- 从头开始实施机器学习算法的好处
- 更好的朴素贝叶斯:从朴素贝叶斯算法中获取最多的12个技巧
- 机器学习的提升和AdaBoost
- 选择机器学习算法:Microsoft Azure的经验教训
- 机器学习的分类和回归树
- 什么是机器学习中的混淆矩阵
- 如何使用Python从头开始创建算法测试工具
- 通过创建机器学习算法的目标列表来控制
- 从头开始停止编码机器学习算法
- 在实现机器学习算法时,不要从开源代码开始
- 不要使用随机猜测作为基线分类器
- 浅谈机器学习中的概念漂移
- 温和介绍机器学习中的偏差 - 方差权衡
- 机器学习的梯度下降
- 机器学习算法如何工作(他们学习输入到输出的映射)
- 如何建立机器学习算法的直觉
- 如何实现机器学习算法
- 如何研究机器学习算法行为
- 如何学习机器学习算法
- 如何研究机器学习算法
- 如何研究机器学习算法
- 如何在Python中从头开始实现反向传播算法
- 如何用Python从头开始实现Bagging
- 如何用Python从头开始实现基线机器学习算法
- 如何在Python中从头开始实现决策树算法
- 如何用Python从头开始实现学习向量量化
- 如何利用Python从头开始随机梯度下降实现线性回归
- 如何利用Python从头开始随机梯度下降实现Logistic回归
- 如何用Python从头开始实现机器学习算法表现指标
- 如何在Python中从头开始实现感知器算法
- 如何在Python中从零开始实现随机森林
- 如何在Python中从头开始实现重采样方法
- 如何用Python从头开始实现简单线性回归
- 如何用Python从头开始实现堆栈泛化(Stacking)
- K-Nearest Neighbors for Machine Learning
- 学习机器学习的向量量化
- 机器学习的线性判别分析
- 机器学习的线性回归
- 使用梯度下降进行机器学习的线性回归教程
- 如何在Python中从头开始加载机器学习数据
- 机器学习的Logistic回归
- 机器学习的Logistic回归教程
- 机器学习算法迷你课程
- 如何在Python中从头开始实现朴素贝叶斯
- 朴素贝叶斯机器学习
- 朴素贝叶斯机器学习教程
- 机器学习算法的过拟合和欠拟合
- 参数化和非参数机器学习算法
- 理解任何机器学习算法的6个问题
- 在机器学习中拥抱随机性
- 如何使用Python从头开始扩展机器学习数据
- 机器学习的简单线性回归教程
- 有监督和无监督的机器学习算法
- 用于机器学习的支持向量机
- 在没有数学背景的情况下理解机器学习算法的5种技术
- 最好的机器学习算法
- 教程从头开始在Python中实现k-Nearest Neighbors
- 通过从零开始实现它们来理解机器学习算法(以及绕过坏代码的策略)
- 使用随机森林:在121个数据集上测试179个分类器
- 为什么从零开始实现机器学习算法
- Machine Learning Mastery 机器学习入门教程
- 机器学习入门的四个步骤:初学者入门与实践的自上而下策略
- 你应该培养的 5 个机器学习领域
- 一种选择机器学习算法的数据驱动方法
- 机器学习中的分析与数值解
- 应用机器学习是一种精英政治
- 机器学习的基本概念
- 如何成为数据科学家
- 初学者如何在机器学习中弄错
- 机器学习的最佳编程语言
- 构建机器学习组合
- 机器学习中分类与回归的区别
- 评估自己作为数据科学家并利用结果建立惊人的数据科学团队
- 探索 Kaggle 大师的方法论和心态:对 Diogo Ferreira 的采访
- 扩展机器学习工具并展示掌握
- 通过寻找地标开始机器学习
- 温和地介绍预测建模
- 通过提供结果在机器学习中获得梦想的工作
- 如何开始机器学习:自学蓝图
- 开始并在机器学习方面取得进展
- 应用机器学习的 Hello World
- 初学者如何使用小型项目开始机器学习并在 Kaggle 上进行竞争
- 我如何开始机器学习? (简短版)
- 我是如何开始机器学习的
- 如何在机器学习中取得更好的成绩
- 如何从在银行工作到担任 Target 的高级数据科学家
- 如何学习任何机器学习工具
- 使用小型目标项目深入了解机器学习工具
- 获得付费申请机器学习
- 映射机器学习工具的景观
- 机器学习开发环境
- 机器学习金钱
- 程序员的机器学习
- 机器学习很有意思
- 机器学习是 Kaggle 比赛
- 机器学习现在很受欢迎
- 机器学习掌握方法
- 机器学习很重要
- 机器学习 Q& A:概念漂移,更好的结果和学习更快
- 缺乏自学机器学习的路线图
- 机器学习很重要
- 快速了解任何机器学习工具(即使您是初学者)
- 机器学习工具
- 找到你的机器学习部落
- 机器学习在一年
- 通过竞争一致的大师 Kaggle
- 5 程序员在机器学习中开始犯错误
- 哲学毕业生到机器学习从业者(Brian Thomas 采访)
- 机器学习入门的实用建议
- 实用机器学习问题
- 使用来自 UCI 机器学习库的数据集练习机器学习
- 使用秘籍的任何机器学习工具快速启动
- 程序员可以进入机器学习
- 程序员应该进入机器学习
- 项目焦点:Shashank Singh 的人脸识别
- 项目焦点:使用 Mahout 和 Konstantin Slisenko 进行堆栈交换群集
- 机器学习自学指南
- 4 个自学机器学习项目
- ÁlvaroLemos 如何在数据科学团队中获得机器学习实习
- 如何思考机器学习
- 现实世界机器学习问题之旅
- 有关机器学习的有用知识
- 如果我没有学位怎么办?
- 如果我不是一个优秀的程序员怎么办?
- 如果我不擅长数学怎么办?
- 为什么机器学习算法会处理以前从未见过的数据?
- 是什么阻碍了你的机器学习目标?
- 什么是机器学习?
- 机器学习适合哪里?
- 为什么要进入机器学习?
- 研究对您来说很重要的机器学习问题
- 你这样做是错的。为什么机器学习不必如此困难
- Machine Learning Mastery Sklearn 教程
- Scikit-Learn 的温和介绍:Python 机器学习库
- 使用 Python 管道和 scikit-learn 自动化机器学习工作流程
- 如何以及何时使用带有 scikit-learn 的校准分类模型
- 如何比较 Python 中的机器学习算法与 scikit-learn
- 用于机器学习开发人员的 Python 崩溃课程
- 用 scikit-learn 在 Python 中集成机器学习算法
- 使用重采样评估 Python 中机器学习算法的表现
- 使用 Scikit-Learn 在 Python 中进行特征选择
- Python 中机器学习的特征选择
- 如何使用 scikit-learn 在 Python 中生成测试数据集
- scikit-learn 中的机器学习算法秘籍
- 如何使用 Python 处理丢失的数据
- 如何开始使用 Python 进行机器学习
- 如何使用 Scikit-Learn 在 Python 中加载数据
- Python 中概率评分方法的简要介绍
- 如何用 Scikit-Learn 调整算法参数
- 如何在 Mac OS X 上安装 Python 3 环境以进行机器学习和深度学习
- 使用 scikit-learn 进行机器学习简介
- 从 shell 到一本带有 Fernando Perez 单一工具的书的 IPython
- 如何使用 Python 3 为机器学习开发创建 Linux 虚拟机
- 如何在 Python 中加载机器学习数据
- 您在 Python 中的第一个机器学习项目循序渐进
- 如何使用 scikit-learn 进行预测
- 用于评估 Python 中机器学习算法的度量标准
- 使用 Pandas 为 Python 中的机器学习准备数据
- 如何使用 Scikit-Learn 为 Python 机器学习准备数据
- 项目焦点:使用 Artem Yankov 在 Python 中进行事件推荐
- 用于机器学习的 Python 生态系统
- Python 是应用机器学习的成长平台
- Python 机器学习书籍
- Python 机器学习迷你课程
- 使用 Pandas 快速和肮脏的数据分析
- 使用 Scikit-Learn 重新调整 Python 中的机器学习数据
- 如何以及何时使用 ROC 曲线和精确调用曲线进行 Python 分类
- 使用 scikit-learn 在 Python 中保存和加载机器学习模型
- scikit-learn Cookbook 书评
- 如何使用 Anaconda 为机器学习和深度学习设置 Python 环境
- 使用 scikit-learn 在 Python 中进行 Spot-Check 分类机器学习算法
- 如何在 Python 中开发可重复使用的抽样检查算法框架
- 使用 scikit-learn 在 Python 中进行 Spot-Check 回归机器学习算法
- 使用 Python 中的描述性统计来了解您的机器学习数据
- 使用 OpenCV,Python 和模板匹配来播放“哪里是 Waldo?”
- 使用 Pandas 在 Python 中可视化机器学习数据
- Machine Learning Mastery 统计学教程
- 浅谈计算正态汇总统计量
- 非参数统计的温和介绍
- Python中常态测试的温和介绍
- 浅谈Bootstrap方法
- 浅谈机器学习的中心极限定理
- 浅谈机器学习中的大数定律
- 机器学习的所有统计数据
- 如何计算Python中机器学习结果的Bootstrap置信区间
- 浅谈机器学习的Chi-Squared测试
- 机器学习的置信区间
- 随机化在机器学习中解决混杂变量的作用
- 机器学习中的受控实验
- 机器学习统计学速成班
- 统计假设检验的关键值以及如何在Python中计算它们
- 如何在机器学习中谈论数据(统计学和计算机科学术语)
- Python中数据可视化方法的简要介绍
- Python中效果大小度量的温和介绍
- 估计随机机器学习算法的实验重复次数
- 机器学习评估统计的温和介绍
- 如何计算Python中的非参数秩相关性
- 如何在Python中计算数据的5位数摘要
- 如何在Python中从头开始编写学生t检验
- 如何在Python中生成随机数
- 如何转换数据以更好地拟合正态分布
- 如何使用相关来理解变量之间的关系
- 如何使用统计信息识别数据中的异常值
- 用于Python机器学习的随机数生成器简介
- k-fold交叉验证的温和介绍
- 如何计算McNemar的比较两种机器学习量词的测试
- Python中非参数统计显着性测试简介
- 如何在Python中使用参数统计显着性测试
- 机器学习的预测间隔
- 应用统计学与机器学习的密切关系
- 如何使用置信区间报告分类器表现
- 统计数据分布的简要介绍
- 15 Python中的统计假设检验(备忘单)
- 统计假设检验的温和介绍
- 10如何在机器学习项目中使用统计方法的示例
- Python中统计功效和功耗分析的简要介绍
- 统计抽样和重新抽样的简要介绍
- 比较机器学习算法的统计显着性检验
- 机器学习中统计容差区间的温和介绍
- 机器学习统计书籍
- 评估机器学习模型的统计数据
- 机器学习统计(7天迷你课程)
- 用于机器学习的简明英语统计
- 如何使用统计显着性检验来解释机器学习结果
- 什么是统计(为什么它在机器学习中很重要)?
- Machine Learning Mastery 时间序列入门教程
- 如何在 Python 中为时间序列预测创建 ARIMA 模型
- 用 Python 进行时间序列预测的自回归模型
- 如何回溯机器学习模型的时间序列预测
- Python 中基于时间序列数据的基本特征工程
- R 的时间序列预测热门书籍
- 10 挑战机器学习时间序列预测问题
- 如何将时间序列转换为 Python 中的监督学习问题
- 如何将时间序列数据分解为趋势和季节性
- 如何用 ARCH 和 GARCH 模拟波动率进行时间序列预测
- 如何将时间序列数据集与 Python 区分开来
- Python 中时间序列预测的指数平滑的温和介绍
- 用 Python 进行时间序列预测的特征选择
- 浅谈自相关和部分自相关
- 时间序列预测的 Box-Jenkins 方法简介
- 用 Python 简要介绍时间序列的时间序列预测
- 如何使用 Python 网格搜索 ARIMA 模型超参数
- 如何在 Python 中加载和探索时间序列数据
- 如何使用 Python 对 ARIMA 模型进行手动预测
- 如何用 Python 进行时间序列预测的预测
- 如何使用 Python 中的 ARIMA 进行样本外预测
- 如何利用 Python 模拟残差错误来纠正时间序列预测
- 使用 Python 进行数据准备,特征工程和时间序列预测的移动平均平滑
- 多步时间序列预测的 4 种策略
- 如何在 Python 中规范化和标准化时间序列数据
- 如何利用 Python 进行时间序列预测的基线预测
- 如何使用 Python 对时间序列预测数据进行功率变换
- 用于时间序列预测的 Python 环境
- 如何重构时间序列预测问题
- 如何使用 Python 重新采样和插值您的时间序列数据
- 用 Python 编写 SARIMA 时间序列预测
- 如何在 Python 中保存 ARIMA 时间序列预测模型
- 使用 Python 进行季节性持久性预测
- 基于 ARIMA 的 Python 历史规模敏感性预测技巧分析
- 简单的时间序列预测模型进行测试,这样你就不会欺骗自己
- 标准多变量,多步骤和多站点时间序列预测问题
- 如何使用 Python 检查时间序列数据是否是固定的
- 使用 Python 进行时间序列数据可视化
- 7 个机器学习的时间序列数据集
- 时间序列预测案例研究与 Python:波士顿每月武装抢劫案
- Python 的时间序列预测案例研究:巴尔的摩的年度用水量
- 使用 Python 进行时间序列预测研究:法国香槟的月销售额
- 使用 Python 的置信区间理解时间序列预测不确定性
- 11 Python 中的经典时间序列预测方法(备忘单)
- 使用 Python 进行时间序列预测表现测量
- 使用 Python 7 天迷你课程进行时间序列预测
- 时间序列预测作为监督学习
- 什么是时间序列预测?
- 如何使用 Python 识别和删除时间序列数据的季节性
- 如何在 Python 中使用和删除时间序列数据中的趋势信息
- 如何在 Python 中调整 ARIMA 参数
- 如何用 Python 可视化时间序列残差预测错误
- 白噪声时间序列与 Python
- 如何通过时间序列预测项目
- Machine Learning Mastery XGBoost 教程
- 通过在 Python 中使用 XGBoost 提前停止来避免过度拟合
- 如何在 Python 中调优 XGBoost 的多线程支持
- 如何配置梯度提升算法
- 在 Python 中使用 XGBoost 进行梯度提升的数据准备
- 如何使用 scikit-learn 在 Python 中开发您的第一个 XGBoost 模型
- 如何在 Python 中使用 XGBoost 评估梯度提升模型
- 在 Python 中使用 XGBoost 的特征重要性和特征选择
- 浅谈机器学习的梯度提升算法
- 应用机器学习的 XGBoost 简介
- 如何在 macOS 上为 Python 安装 XGBoost
- 如何在 Python 中使用 XGBoost 保存梯度提升模型
- 从梯度提升开始,比较 165 个数据集上的 13 种算法
- 在 Python 中使用 XGBoost 和 scikit-learn 进行随机梯度提升
- 如何使用 Amazon Web Services 在云中训练 XGBoost 模型
- 在 Python 中使用 XGBoost 调整梯度提升的学习率
- 如何在 Python 中使用 XGBoost 调整决策树的数量和大小
- 如何在 Python 中使用 XGBoost 可视化梯度提升决策树
- 在 Python 中开始使用 XGBoost 的 7 步迷你课程
