## 7.2 采样误差
不管我们的样本有多具有代表性,我们根据样本计算的统计数据很可能至少与总体参数略有不同。我们称之为 _ 采样误差 _。我们的统计估计值也会因样本而异;我们将我们的统计数据在样本间的分布称为 _ 抽样分布 _。
抽样误差直接关系到人口测量的质量。显然,我们希望从样本中获得的估计值尽可能接近总体参数的真实值。然而,即使我们的统计数据是无偏的(也就是说,从长远来看,我们希望它与总体参数具有相同的值),任何特定估计的值都将不同于总体估计,并且当抽样误差较大时,这些差异将更大。因此,减小采样误差是实现更好测量的重要步骤。
我们将使用 nhanes 数据集作为示例;我们将假设 nhanes 是整个总体,然后我们将从总体中随机抽取样本。在下一章中,我们将有更多的话要说,关于“随机”样本的生成是如何在计算机中工作的。
```r
# load the NHANES data library
library(NHANES)
# create a NHANES dataset without duplicated IDs
NHANES <-
NHANES %>%
distinct(ID, .keep_all = TRUE)
#create a dataset of only adults
NHANES_adult <-
NHANES %>%
filter(
!is.na(Height),
Age >= 18
)
#print the NHANES population mean and standard deviation of adult height
sprintf(
"Population height: mean = %.2f",
mean(NHANES_adult$Height)
)
```
```r
## [1] "Population height: mean = 168.35"
```
```r
sprintf(
"Population height: std deviation = %.2f",
sd(NHANES_adult$Height)
)
```
```r
## [1] "Population height: std deviation = 10.16"
```
在这个例子中,我们知道成年人口的平均值和身高的标准偏差,因为我们假设 nhanes 数据集包含整个成年人口。现在,让我们从 NHANES 人群中抽取 50 个个体的单个样本,并将结果统计数据与人口参数进行比较。
```r
# sample 50 individuals from NHANES dataset
exampleSample <-
NHANES_adult %>%
sample_n(50)
#print the sample mean and standard deviation of adult height
sprintf(
'Sample height: mean = %.2f',
mean(exampleSample$Height)
)
```
```r
## [1] "Sample height: mean = 169.46"
```
```r
sprintf(
'Sample height: std deviation = %.2f',
sd(exampleSample$Height)
)
```
```r
## [1] "Sample height: std deviation = 10.07"
```
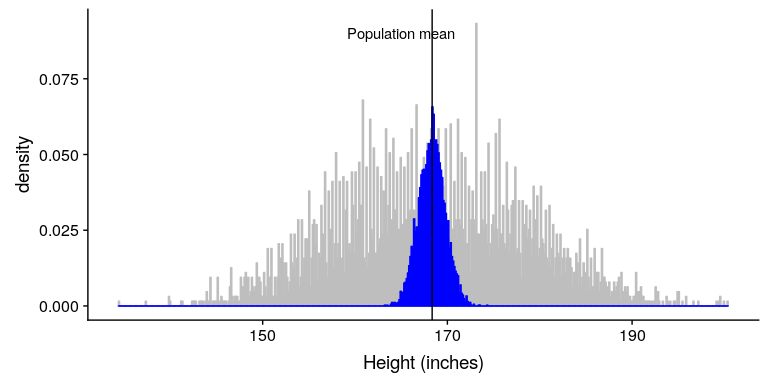
样本平均值和标准差相似,但不完全等于总体值。现在,让我们取 50 个个体的大量样本,计算每个样本的平均值,并查看得出的平均值抽样分布。为了更好地估计抽样分布,我们必须决定要采集多少样本——在这种情况下,让我们采集 5000 个样本,以便我们对答案真正有信心。请注意,像这样的模拟有时需要几分钟才能运行,并且可能会使您的计算机变得气喘吁吁。图[7.1](#fig:samplePlot)中的柱状图显示,对 50 个个体的每个样本估计的平均值有所不同,但总体而言,它们集中在人口平均值周围。
```r
# compute sample means across 5000 samples from NHANES data
sampSize <- 50 # size of sample
nsamps <- 5000 # number of samples we will take
# set up variable to store all of the results
sampMeans <- array(NA, nsamps)
# Loop through and repeatedly sample and compute the mean
for (i in 1:nsamps) {
NHANES_sample <- sample_n(NHANES_adult, sampSize)
sampMeans[i] <- mean(NHANES_sample$Height)
}
sprintf(
"Average sample mean = %.2f",
mean(sampMeans)
)
```
```r
## [1] "Average sample mean = 168.33"
```
```r
sampMeans_df <- tibble(sampMeans = sampMeans)
```

图 7.1 蓝色柱状图显示了来自 nhanes 数据集的 5000 多个随机样本的平均值的抽样分布。完整数据集的柱状图以灰色显示以供参考。
- 前言
- 0.1 本书为什么存在?
- 0.2 你不是统计学家-我们为什么要听你的?
- 0.3 为什么是 R?
- 0.4 数据的黄金时代
- 0.5 开源书籍
- 0.6 确认
- 1 引言
- 1.1 什么是统计思维?
- 1.2 统计数据能为我们做什么?
- 1.3 统计学的基本概念
- 1.4 因果关系与统计
- 1.5 阅读建议
- 2 处理数据
- 2.1 什么是数据?
- 2.2 测量尺度
- 2.3 什么是良好的测量?
- 2.4 阅读建议
- 3 概率
- 3.1 什么是概率?
- 3.2 我们如何确定概率?
- 3.3 概率分布
- 3.4 条件概率
- 3.5 根据数据计算条件概率
- 3.6 独立性
- 3.7 逆转条件概率:贝叶斯规则
- 3.8 数据学习
- 3.9 优势比
- 3.10 概率是什么意思?
- 3.11 阅读建议
- 4 汇总数据
- 4.1 为什么要总结数据?
- 4.2 使用表格汇总数据
- 4.3 分布的理想化表示
- 4.4 阅读建议
- 5 将模型拟合到数据
- 5.1 什么是模型?
- 5.2 统计建模:示例
- 5.3 什么使模型“良好”?
- 5.4 模型是否太好?
- 5.5 最简单的模型:平均值
- 5.6 模式
- 5.7 变异性:平均值与数据的拟合程度如何?
- 5.8 使用模拟了解统计数据
- 5.9 Z 分数
- 6 数据可视化
- 6.1 数据可视化如何拯救生命
- 6.2 绘图解剖
- 6.3 使用 ggplot 在 R 中绘制
- 6.4 良好可视化原则
- 6.5 最大化数据/墨水比
- 6.6 避免图表垃圾
- 6.7 避免数据失真
- 6.8 谎言因素
- 6.9 记住人的局限性
- 6.10 其他因素的修正
- 6.11 建议阅读和视频
- 7 取样
- 7.1 我们如何取样?
- 7.2 采样误差
- 7.3 平均值的标准误差
- 7.4 中心极限定理
- 7.5 置信区间
- 7.6 阅读建议
- 8 重新采样和模拟
- 8.1 蒙特卡罗模拟
- 8.2 统计的随机性
- 8.3 生成随机数
- 8.4 使用蒙特卡罗模拟
- 8.5 使用模拟统计:引导程序
- 8.6 阅读建议
- 9 假设检验
- 9.1 无效假设统计检验(NHST)
- 9.2 无效假设统计检验:一个例子
- 9.3 无效假设检验过程
- 9.4 现代环境下的 NHST:多重测试
- 9.5 阅读建议
- 10 置信区间、效应大小和统计功率
- 10.1 置信区间
- 10.2 效果大小
- 10.3 统计能力
- 10.4 阅读建议
- 11 贝叶斯统计
- 11.1 生成模型
- 11.2 贝叶斯定理与逆推理
- 11.3 进行贝叶斯估计
- 11.4 估计后验分布
- 11.5 选择优先权
- 11.6 贝叶斯假设检验
- 11.7 阅读建议
- 12 分类关系建模
- 12.1 示例:糖果颜色
- 12.2 皮尔逊卡方检验
- 12.3 应急表及双向试验
- 12.4 标准化残差
- 12.5 优势比
- 12.6 贝叶斯系数
- 12.7 超出 2 x 2 表的分类分析
- 12.8 注意辛普森悖论
- 13 建模持续关系
- 13.1 一个例子:仇恨犯罪和收入不平等
- 13.2 收入不平等是否与仇恨犯罪有关?
- 13.3 协方差和相关性
- 13.4 相关性和因果关系
- 13.5 阅读建议
- 14 一般线性模型
- 14.1 线性回归
- 14.2 安装更复杂的模型
- 14.3 变量之间的相互作用
- 14.4“预测”的真正含义是什么?
- 14.5 阅读建议
- 15 比较方法
- 15.1 学生 T 考试
- 15.2 t 检验作为线性模型
- 15.3 平均差的贝叶斯因子
- 15.4 配对 t 检验
- 15.5 比较两种以上的方法
- 16 统计建模过程:一个实例
- 16.1 统计建模过程
- 17 做重复性研究
- 17.1 我们认为科学应该如何运作
- 17.2 科学(有时)是如何工作的
- 17.3 科学中的再现性危机
- 17.4 有问题的研究实践
- 17.5 进行重复性研究
- 17.6 进行重复性数据分析
- 17.7 结论:提高科学水平
- 17.8 阅读建议
- References
