## 7.5 置信区间
大多数人都熟悉政治民意调查“误差幅度”的概念。这些民意测验通常试图提供一个准确率在+/-3%以内的答案。例如,当一个候选人被估计以 9 个百分点赢得选举,误差幅度为 3 时,他们将赢得的百分比被估计在 6-12 个百分点之内。在统计学中,我们将这一范围的值称为 _ 置信区间 _,它提供了对我们的估计与总体参数的接近程度的不确定性程度的度量。条件区间越大,我们的不确定性就越大。
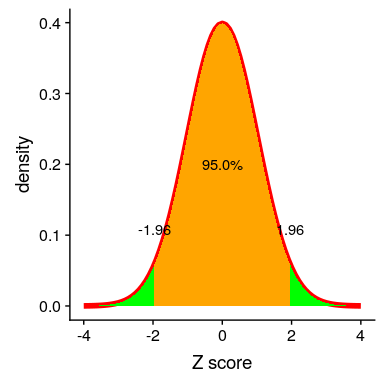
在上一节中我们看到,有了足够的样本量,平均值的抽样分布是正态分布的,标准误差描述了这个抽样分布的标准偏差。利用这些知识,我们可以问:我们期望在什么范围内获取所有平均值估计值的 95%?为了回答这个问题,我们可以使用正态分布,我们知道我们期望 95%的样本均值在正态分布之间下降。具体来说,我们使用正态分布的 _ 分位数 _ 函数(`qnorm()`in r)来确定正态分布在分布中 2.5%和 97.5%点的值。我们选择这些点是因为我们想要找到分布中心的 95%的值,所以我们需要在每个端部截取 2.5%个,以便最终在中间有 95%个。图[7.4](#fig:normalCutoffs)显示了发生在上的情况。

图 7.4 正态分布,中间橙色部分表示我们预计所有值 95%会下降的范围。绿色部分显示了分布中更极端的部分,我们希望在不到 5%的时间内发生。
使用这些截止值,我们可以为平均值的估计创建一个置信区间:

让我们计算 nhanes 高度数据的置信区间,
```r
# compute confidence intervals
NHANES_sample <- sample_n(NHANES_adult,250)
sample_summary <- NHANES_sample %>%
summarize(mean=mean(Height),
sem=sd(Height)/sqrt(sampSize)) %>%
mutate(CI_lower=mean-1.96*sem,
CI_upper=mean+1.96*sem)
pander(sample_summary)
```
<colgroup><col style="width: 13%"> <col style="width: 11%"> <col style="width: 15%"> <col style="width: 15%"></colgroup>
| 意思是 | 扫描电镜 | Ci_ 下 | Ci_ 上部 |
| --- | --- | --- | --- |
| 166.869 年 | 1.446 个 | 164.036 年 | 169.702 个 |
置信区间是出了名的混乱,主要是因为它们并不代表我们希望它们的含义。很自然地认为,95%的置信区间告诉我们,人口平均值有 95%的概率落在区间内。然而,正如我们将在整个课程中看到的,统计中的概念通常并不意味着我们认为它们应该意味着什么。在置信区间的情况下,我们不能用这种方式解释它们,因为总体参数有一个固定值——要么在区间内,要么不在区间内。95%置信区间的正确解释是,它将捕获 95%时间的真实总体平均值。我们可以通过重复对 nhanes 数据重新采样并计算间隔包含真实总体平均值的频率来确认这一点。
```r
# compute how often the confidence interval contains the true population mean
nsamples <- 2500
sampSize <- 100
ci_contains_mean <- array(NA,nsamples)
for (i in 1:nsamples) {
NHANES_sample <- sample_n(NHANES_adult, sampSize)
sample_summary <-
NHANES_sample %>%
summarize(
mean = mean(Height),
sem = sd(Height) / sqrt(sampSize)
) %>%
mutate(
CI_upper = mean + 1.96 * sem,
CI_lower = mean - 1.96 * sem
)
ci_contains_mean[i] <-
(sample_summary$CI_upper > mean(NHANES_adult$Height)) &
(sample_summary$CI_lower < mean(NHANES_adult$Height))
}
sprintf(
'proportion of confidence intervals containing population mean: %.3f',
mean(ci_contains_mean)
)
```
```r
## [1] "proportion of confidence intervals containing population mean: 0.953"
```
这证实了置信区间确实捕获了 95%左右的人口平均值。
- 前言
- 0.1 本书为什么存在?
- 0.2 你不是统计学家-我们为什么要听你的?
- 0.3 为什么是 R?
- 0.4 数据的黄金时代
- 0.5 开源书籍
- 0.6 确认
- 1 引言
- 1.1 什么是统计思维?
- 1.2 统计数据能为我们做什么?
- 1.3 统计学的基本概念
- 1.4 因果关系与统计
- 1.5 阅读建议
- 2 处理数据
- 2.1 什么是数据?
- 2.2 测量尺度
- 2.3 什么是良好的测量?
- 2.4 阅读建议
- 3 概率
- 3.1 什么是概率?
- 3.2 我们如何确定概率?
- 3.3 概率分布
- 3.4 条件概率
- 3.5 根据数据计算条件概率
- 3.6 独立性
- 3.7 逆转条件概率:贝叶斯规则
- 3.8 数据学习
- 3.9 优势比
- 3.10 概率是什么意思?
- 3.11 阅读建议
- 4 汇总数据
- 4.1 为什么要总结数据?
- 4.2 使用表格汇总数据
- 4.3 分布的理想化表示
- 4.4 阅读建议
- 5 将模型拟合到数据
- 5.1 什么是模型?
- 5.2 统计建模:示例
- 5.3 什么使模型“良好”?
- 5.4 模型是否太好?
- 5.5 最简单的模型:平均值
- 5.6 模式
- 5.7 变异性:平均值与数据的拟合程度如何?
- 5.8 使用模拟了解统计数据
- 5.9 Z 分数
- 6 数据可视化
- 6.1 数据可视化如何拯救生命
- 6.2 绘图解剖
- 6.3 使用 ggplot 在 R 中绘制
- 6.4 良好可视化原则
- 6.5 最大化数据/墨水比
- 6.6 避免图表垃圾
- 6.7 避免数据失真
- 6.8 谎言因素
- 6.9 记住人的局限性
- 6.10 其他因素的修正
- 6.11 建议阅读和视频
- 7 取样
- 7.1 我们如何取样?
- 7.2 采样误差
- 7.3 平均值的标准误差
- 7.4 中心极限定理
- 7.5 置信区间
- 7.6 阅读建议
- 8 重新采样和模拟
- 8.1 蒙特卡罗模拟
- 8.2 统计的随机性
- 8.3 生成随机数
- 8.4 使用蒙特卡罗模拟
- 8.5 使用模拟统计:引导程序
- 8.6 阅读建议
- 9 假设检验
- 9.1 无效假设统计检验(NHST)
- 9.2 无效假设统计检验:一个例子
- 9.3 无效假设检验过程
- 9.4 现代环境下的 NHST:多重测试
- 9.5 阅读建议
- 10 置信区间、效应大小和统计功率
- 10.1 置信区间
- 10.2 效果大小
- 10.3 统计能力
- 10.4 阅读建议
- 11 贝叶斯统计
- 11.1 生成模型
- 11.2 贝叶斯定理与逆推理
- 11.3 进行贝叶斯估计
- 11.4 估计后验分布
- 11.5 选择优先权
- 11.6 贝叶斯假设检验
- 11.7 阅读建议
- 12 分类关系建模
- 12.1 示例:糖果颜色
- 12.2 皮尔逊卡方检验
- 12.3 应急表及双向试验
- 12.4 标准化残差
- 12.5 优势比
- 12.6 贝叶斯系数
- 12.7 超出 2 x 2 表的分类分析
- 12.8 注意辛普森悖论
- 13 建模持续关系
- 13.1 一个例子:仇恨犯罪和收入不平等
- 13.2 收入不平等是否与仇恨犯罪有关?
- 13.3 协方差和相关性
- 13.4 相关性和因果关系
- 13.5 阅读建议
- 14 一般线性模型
- 14.1 线性回归
- 14.2 安装更复杂的模型
- 14.3 变量之间的相互作用
- 14.4“预测”的真正含义是什么?
- 14.5 阅读建议
- 15 比较方法
- 15.1 学生 T 考试
- 15.2 t 检验作为线性模型
- 15.3 平均差的贝叶斯因子
- 15.4 配对 t 检验
- 15.5 比较两种以上的方法
- 16 统计建模过程:一个实例
- 16.1 统计建模过程
- 17 做重复性研究
- 17.1 我们认为科学应该如何运作
- 17.2 科学(有时)是如何工作的
- 17.3 科学中的再现性危机
- 17.4 有问题的研究实践
- 17.5 进行重复性研究
- 17.6 进行重复性数据分析
- 17.7 结论:提高科学水平
- 17.8 阅读建议
- References
