## 14.2 安装更复杂的模型
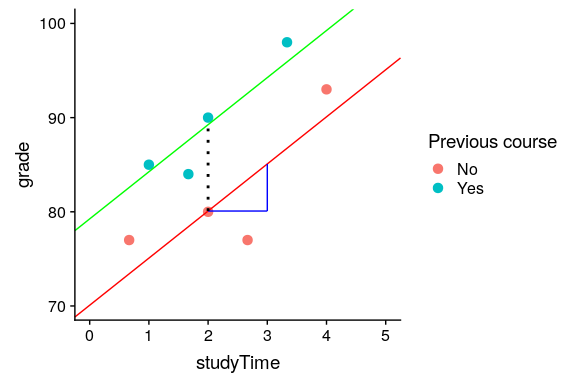
我们通常希望了解多个变量对某些特定结果的影响,以及它们如何相互关联。在我们学习时间的例子中,假设我们发现一些学生以前参加过关于这个主题的课程。如果我们绘制他们的成绩(见图[14.4](#fig:StudytimeGradesPrior)),我们可以看到,在相同的学习时间内,那些上过一门课的学生比没有上过课的学生表现要好得多。

图 14.4 学习时间和成绩之间的关系,颜色标识每个学生是否上过该主题的课程
我们希望建立一个考虑到这一点的统计模型,我们可以通过扩展我们在上面建立的模型来实现这一点:

为了模拟每个人是否有以前的类,我们使用我们称之为 _ 的伪编码 _ 来创建一个新变量,该变量的值为 1 表示以前有过一个类,否则为零。这意味着,对于以前上过课的人,我们只需将的值添加到他们的预测值中——也就是说,使用虚拟编码只是反映了两组人之间的平均值差异。我们对的估计反映了所有数据点的回归斜率——我们假设回归斜率是相同的,不管以前是否有过类(见图[14.5](#fig:LinearRegressionByPriorClass))。
```r
# perform linear regression for study time and prior class
# must change priorClass to a factor variable
df$priorClass <- as.factor(df$priorClass)
lmResultTwoVars <- lm(grade ~ studyTime + priorClass, data = df)
summary(lmResultTwoVars)
```
```r
##
## Call:
## lm(formula = grade ~ studyTime + priorClass, data = df)
##
## Residuals:
## 1 2 3 4 5 6 7 8
## 3.5833 0.7500 -3.5833 -0.0833 0.7500 -6.4167 2.0833 2.9167
##
## Coefficients:
## Estimate Std. Error t value Pr(>|t|)
## (Intercept) 70.08 3.77 18.60 8.3e-06 ***
## studyTime 5.00 1.37 3.66 0.015 *
## priorClass1 9.17 2.88 3.18 0.024 *
## ---
## Signif. codes: 0 '***' 0.001 '**' 0.01 '*' 0.05 '.' 0.1 ' ' 1
##
## Residual standard error: 4 on 5 degrees of freedom
## Multiple R-squared: 0.803, Adjusted R-squared: 0.724
## F-statistic: 10.2 on 2 and 5 DF, p-value: 0.0173
```

图 14.5 研究时间和年级之间的关系,包括作为模型中额外组成部分的先前经验。蓝线表示与学习时间相关的坡度,黑色虚线表示两组之间平均值的差异。
- 前言
- 0.1 本书为什么存在?
- 0.2 你不是统计学家-我们为什么要听你的?
- 0.3 为什么是 R?
- 0.4 数据的黄金时代
- 0.5 开源书籍
- 0.6 确认
- 1 引言
- 1.1 什么是统计思维?
- 1.2 统计数据能为我们做什么?
- 1.3 统计学的基本概念
- 1.4 因果关系与统计
- 1.5 阅读建议
- 2 处理数据
- 2.1 什么是数据?
- 2.2 测量尺度
- 2.3 什么是良好的测量?
- 2.4 阅读建议
- 3 概率
- 3.1 什么是概率?
- 3.2 我们如何确定概率?
- 3.3 概率分布
- 3.4 条件概率
- 3.5 根据数据计算条件概率
- 3.6 独立性
- 3.7 逆转条件概率:贝叶斯规则
- 3.8 数据学习
- 3.9 优势比
- 3.10 概率是什么意思?
- 3.11 阅读建议
- 4 汇总数据
- 4.1 为什么要总结数据?
- 4.2 使用表格汇总数据
- 4.3 分布的理想化表示
- 4.4 阅读建议
- 5 将模型拟合到数据
- 5.1 什么是模型?
- 5.2 统计建模:示例
- 5.3 什么使模型“良好”?
- 5.4 模型是否太好?
- 5.5 最简单的模型:平均值
- 5.6 模式
- 5.7 变异性:平均值与数据的拟合程度如何?
- 5.8 使用模拟了解统计数据
- 5.9 Z 分数
- 6 数据可视化
- 6.1 数据可视化如何拯救生命
- 6.2 绘图解剖
- 6.3 使用 ggplot 在 R 中绘制
- 6.4 良好可视化原则
- 6.5 最大化数据/墨水比
- 6.6 避免图表垃圾
- 6.7 避免数据失真
- 6.8 谎言因素
- 6.9 记住人的局限性
- 6.10 其他因素的修正
- 6.11 建议阅读和视频
- 7 取样
- 7.1 我们如何取样?
- 7.2 采样误差
- 7.3 平均值的标准误差
- 7.4 中心极限定理
- 7.5 置信区间
- 7.6 阅读建议
- 8 重新采样和模拟
- 8.1 蒙特卡罗模拟
- 8.2 统计的随机性
- 8.3 生成随机数
- 8.4 使用蒙特卡罗模拟
- 8.5 使用模拟统计:引导程序
- 8.6 阅读建议
- 9 假设检验
- 9.1 无效假设统计检验(NHST)
- 9.2 无效假设统计检验:一个例子
- 9.3 无效假设检验过程
- 9.4 现代环境下的 NHST:多重测试
- 9.5 阅读建议
- 10 置信区间、效应大小和统计功率
- 10.1 置信区间
- 10.2 效果大小
- 10.3 统计能力
- 10.4 阅读建议
- 11 贝叶斯统计
- 11.1 生成模型
- 11.2 贝叶斯定理与逆推理
- 11.3 进行贝叶斯估计
- 11.4 估计后验分布
- 11.5 选择优先权
- 11.6 贝叶斯假设检验
- 11.7 阅读建议
- 12 分类关系建模
- 12.1 示例:糖果颜色
- 12.2 皮尔逊卡方检验
- 12.3 应急表及双向试验
- 12.4 标准化残差
- 12.5 优势比
- 12.6 贝叶斯系数
- 12.7 超出 2 x 2 表的分类分析
- 12.8 注意辛普森悖论
- 13 建模持续关系
- 13.1 一个例子:仇恨犯罪和收入不平等
- 13.2 收入不平等是否与仇恨犯罪有关?
- 13.3 协方差和相关性
- 13.4 相关性和因果关系
- 13.5 阅读建议
- 14 一般线性模型
- 14.1 线性回归
- 14.2 安装更复杂的模型
- 14.3 变量之间的相互作用
- 14.4“预测”的真正含义是什么?
- 14.5 阅读建议
- 15 比较方法
- 15.1 学生 T 考试
- 15.2 t 检验作为线性模型
- 15.3 平均差的贝叶斯因子
- 15.4 配对 t 检验
- 15.5 比较两种以上的方法
- 16 统计建模过程:一个实例
- 16.1 统计建模过程
- 17 做重复性研究
- 17.1 我们认为科学应该如何运作
- 17.2 科学(有时)是如何工作的
- 17.3 科学中的再现性危机
- 17.4 有问题的研究实践
- 17.5 进行重复性研究
- 17.6 进行重复性数据分析
- 17.7 结论:提高科学水平
- 17.8 阅读建议
- References
