## 13.2 收入不平等是否与仇恨犯罪有关?
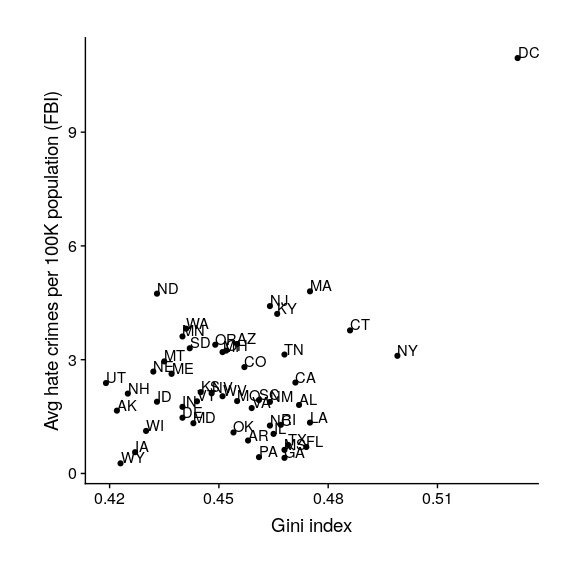
现在我们了解了基尼指数,我们可以看看收入不平等与仇恨犯罪率之间的关系(见图[13.2](#fig:hateCrimeGini))。
```r
hateCrimes <-
hate_crimes %>%
mutate(state_abb = state.abb[match(state,state.name)]) %>%
drop_na(avg_hatecrimes_per_100k_fbi)
hateCrimes$state_abb[hateCrimes$state=="District of Columbia"]='DC'
ggplot(hateCrimes,aes(gini_index,avg_hatecrimes_per_100k_fbi,label=state_abb)) +
geom_point() +
geom_text(aes(label=state_abb),hjust=0, vjust=0) +
theme(plot.title = element_text(size = 20, face = "bold")) +
xlab('Gini index') +
ylab('Avg hate crimes per 100K population (FBI)') +
theme(plot.margin = unit(c(1,1,1,1), "cm"))
```

图 13.2 仇恨犯罪率与基尼指数的关系图。
从数据来看,这两个变量之间似乎有一个正的关系。我们如何量化这种关系?
- 前言
- 0.1 本书为什么存在?
- 0.2 你不是统计学家-我们为什么要听你的?
- 0.3 为什么是 R?
- 0.4 数据的黄金时代
- 0.5 开源书籍
- 0.6 确认
- 1 引言
- 1.1 什么是统计思维?
- 1.2 统计数据能为我们做什么?
- 1.3 统计学的基本概念
- 1.4 因果关系与统计
- 1.5 阅读建议
- 2 处理数据
- 2.1 什么是数据?
- 2.2 测量尺度
- 2.3 什么是良好的测量?
- 2.4 阅读建议
- 3 概率
- 3.1 什么是概率?
- 3.2 我们如何确定概率?
- 3.3 概率分布
- 3.4 条件概率
- 3.5 根据数据计算条件概率
- 3.6 独立性
- 3.7 逆转条件概率:贝叶斯规则
- 3.8 数据学习
- 3.9 优势比
- 3.10 概率是什么意思?
- 3.11 阅读建议
- 4 汇总数据
- 4.1 为什么要总结数据?
- 4.2 使用表格汇总数据
- 4.3 分布的理想化表示
- 4.4 阅读建议
- 5 将模型拟合到数据
- 5.1 什么是模型?
- 5.2 统计建模:示例
- 5.3 什么使模型“良好”?
- 5.4 模型是否太好?
- 5.5 最简单的模型:平均值
- 5.6 模式
- 5.7 变异性:平均值与数据的拟合程度如何?
- 5.8 使用模拟了解统计数据
- 5.9 Z 分数
- 6 数据可视化
- 6.1 数据可视化如何拯救生命
- 6.2 绘图解剖
- 6.3 使用 ggplot 在 R 中绘制
- 6.4 良好可视化原则
- 6.5 最大化数据/墨水比
- 6.6 避免图表垃圾
- 6.7 避免数据失真
- 6.8 谎言因素
- 6.9 记住人的局限性
- 6.10 其他因素的修正
- 6.11 建议阅读和视频
- 7 取样
- 7.1 我们如何取样?
- 7.2 采样误差
- 7.3 平均值的标准误差
- 7.4 中心极限定理
- 7.5 置信区间
- 7.6 阅读建议
- 8 重新采样和模拟
- 8.1 蒙特卡罗模拟
- 8.2 统计的随机性
- 8.3 生成随机数
- 8.4 使用蒙特卡罗模拟
- 8.5 使用模拟统计:引导程序
- 8.6 阅读建议
- 9 假设检验
- 9.1 无效假设统计检验(NHST)
- 9.2 无效假设统计检验:一个例子
- 9.3 无效假设检验过程
- 9.4 现代环境下的 NHST:多重测试
- 9.5 阅读建议
- 10 置信区间、效应大小和统计功率
- 10.1 置信区间
- 10.2 效果大小
- 10.3 统计能力
- 10.4 阅读建议
- 11 贝叶斯统计
- 11.1 生成模型
- 11.2 贝叶斯定理与逆推理
- 11.3 进行贝叶斯估计
- 11.4 估计后验分布
- 11.5 选择优先权
- 11.6 贝叶斯假设检验
- 11.7 阅读建议
- 12 分类关系建模
- 12.1 示例:糖果颜色
- 12.2 皮尔逊卡方检验
- 12.3 应急表及双向试验
- 12.4 标准化残差
- 12.5 优势比
- 12.6 贝叶斯系数
- 12.7 超出 2 x 2 表的分类分析
- 12.8 注意辛普森悖论
- 13 建模持续关系
- 13.1 一个例子:仇恨犯罪和收入不平等
- 13.2 收入不平等是否与仇恨犯罪有关?
- 13.3 协方差和相关性
- 13.4 相关性和因果关系
- 13.5 阅读建议
- 14 一般线性模型
- 14.1 线性回归
- 14.2 安装更复杂的模型
- 14.3 变量之间的相互作用
- 14.4“预测”的真正含义是什么?
- 14.5 阅读建议
- 15 比较方法
- 15.1 学生 T 考试
- 15.2 t 检验作为线性模型
- 15.3 平均差的贝叶斯因子
- 15.4 配对 t 检验
- 15.5 比较两种以上的方法
- 16 统计建模过程:一个实例
- 16.1 统计建模过程
- 17 做重复性研究
- 17.1 我们认为科学应该如何运作
- 17.2 科学(有时)是如何工作的
- 17.3 科学中的再现性危机
- 17.4 有问题的研究实践
- 17.5 进行重复性研究
- 17.6 进行重复性数据分析
- 17.7 结论:提高科学水平
- 17.8 阅读建议
- References
