## 8.5 使用模拟统计:引导程序
到目前为止,我们已经使用模拟来演示统计原理,但是我们也可以使用模拟来回答实际的统计问题。在本节中,我们将介绍一个称为 _ 引导程序 _ 的概念,它允许我们使用模拟来量化统计估计的不确定性。在本课程的后面部分,我们将看到模拟通常如何用于回答统计问题的其他示例,特别是当理论统计方法不可用或假设过于令人窒息时。
### 8.5.1 计算引导程序
在上面的章节中,我们利用我们对平均值抽样分布的了解来计算平均值和置信区间的标准误差。但是如果我们不能假设这些估计是正态分布的,或者我们不知道它们的分布呢?引导的思想是使用数据本身来估计答案。这个名字来自于用自己的力量把自己拉起来的想法,表达了这样一个想法:我们没有任何外部的杠杆来源,所以我们必须依靠数据本身。自举方法是由斯坦福统计局的布拉德利·埃夫隆构想的,他是世界上最有影响力的统计学家之一。
引导背后的想法是,我们从实际的数据集中重复采样;重要的是,我们用替换的对 _ 进行采样,这样同一个数据点通常会在一个样本中被多次表示。然后我们计算每个引导样本的兴趣统计,并使用这些估计的分布。_
让我们从使用引导程序来估计平均值的采样分布开始,这样我们就可以将结果与前面讨论的平均值的标准误差(sem)进行比较。
```r
# perform the bootstrap to compute SEM and compare to parametric method
nRuns <- 2500
sampleSize <- 32
heightSample <-
NHANES_adult %>%
sample_n(sampleSize)
bootMeanHeight <- function(df) {
bootSample <- sample_n(df, dim(df)[1], replace = TRUE)
return(mean(bootSample$Height))
}
bootMeans <- replicate(nRuns, bootMeanHeight(heightSample))
SEM_standard <- sd(heightSample$Height) / sqrt(sampleSize)
sprintf("SEM computed using sample SD: %f", SEM_standard)
```
```r
## [1] "SEM computed using sample SD: 1.595789"
```
```r
SEM_bootstrap <- sd(bootMeans)
sprintf("SEM computed using SD of bootstrap estimates: %f", SEM_bootstrap)
```
```r
## [1] "SEM computed using SD of bootstrap estimates: 1.586913"
```

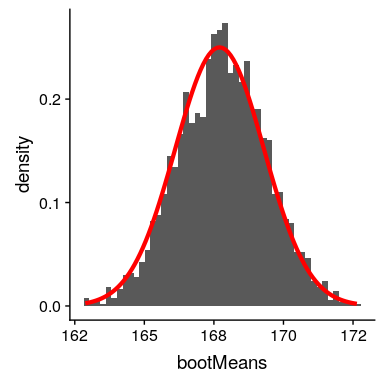
图 8.4 计算平均值标准误差的引导示例。柱状图显示平均值在引导样本之间的分布,红线显示基于样本平均值和标准差的正态分布。
图[8.4](#fig:bootstrapSEM)显示,基于正态性假设,引导样本的平均值分布与理论估计值相当接近。我们也可以使用引导样本计算平均值的置信区间,只需从引导样本的分布计算感兴趣的分位数。
```r
# compute bootstrap confidence interval
bootCI <- quantile(bootMeans, c(0.025, 0.975))
pander("bootstrap confidence limits:")
```
自举置信限:
```r
pander(bootCI)
```
<colgroup><col style="width: 13%"> <col style="width: 13%"></colgroup>
| 2.5% | 98% |
| --- | --- |
| 164.634 年 | 170.883 个 |
```r
# now let's compute the confidence intervals using the sample mean and SD
sampleMean <- mean(heightSample$Height)
normalCI <-
tibble(
"2.5%" = sampleMean - 1.96 * SEM_standard,
"97.5%" = sampleMean + 1.96 * SEM_standard
)
print("confidence limits based on sample SD and normal distribution:")
```
```r
## [1] "confidence limits based on sample SD and normal distribution:"
```
```r
pander(normalCI)
```
<colgroup><col style="width: 13%"> <col style="width: 13%"></colgroup>
| 2.5% | 97.5% |
| --- | --- |
| 164.575 年 | 170.831 个 |
我们通常不会使用引导程序来计算平均值的置信区间(因为我们通常可以假设正态分布适合平均值的抽样分布,只要我们的样本足够大),但是这个例子显示了该方法如何粗略地给出结果与基于正态分布的标准方法相同。在我们知道或怀疑正态分布不合适的情况下,引导程序更常被用来为其他统计数据的估计生成标准错误。
- 前言
- 0.1 本书为什么存在?
- 0.2 你不是统计学家-我们为什么要听你的?
- 0.3 为什么是 R?
- 0.4 数据的黄金时代
- 0.5 开源书籍
- 0.6 确认
- 1 引言
- 1.1 什么是统计思维?
- 1.2 统计数据能为我们做什么?
- 1.3 统计学的基本概念
- 1.4 因果关系与统计
- 1.5 阅读建议
- 2 处理数据
- 2.1 什么是数据?
- 2.2 测量尺度
- 2.3 什么是良好的测量?
- 2.4 阅读建议
- 3 概率
- 3.1 什么是概率?
- 3.2 我们如何确定概率?
- 3.3 概率分布
- 3.4 条件概率
- 3.5 根据数据计算条件概率
- 3.6 独立性
- 3.7 逆转条件概率:贝叶斯规则
- 3.8 数据学习
- 3.9 优势比
- 3.10 概率是什么意思?
- 3.11 阅读建议
- 4 汇总数据
- 4.1 为什么要总结数据?
- 4.2 使用表格汇总数据
- 4.3 分布的理想化表示
- 4.4 阅读建议
- 5 将模型拟合到数据
- 5.1 什么是模型?
- 5.2 统计建模:示例
- 5.3 什么使模型“良好”?
- 5.4 模型是否太好?
- 5.5 最简单的模型:平均值
- 5.6 模式
- 5.7 变异性:平均值与数据的拟合程度如何?
- 5.8 使用模拟了解统计数据
- 5.9 Z 分数
- 6 数据可视化
- 6.1 数据可视化如何拯救生命
- 6.2 绘图解剖
- 6.3 使用 ggplot 在 R 中绘制
- 6.4 良好可视化原则
- 6.5 最大化数据/墨水比
- 6.6 避免图表垃圾
- 6.7 避免数据失真
- 6.8 谎言因素
- 6.9 记住人的局限性
- 6.10 其他因素的修正
- 6.11 建议阅读和视频
- 7 取样
- 7.1 我们如何取样?
- 7.2 采样误差
- 7.3 平均值的标准误差
- 7.4 中心极限定理
- 7.5 置信区间
- 7.6 阅读建议
- 8 重新采样和模拟
- 8.1 蒙特卡罗模拟
- 8.2 统计的随机性
- 8.3 生成随机数
- 8.4 使用蒙特卡罗模拟
- 8.5 使用模拟统计:引导程序
- 8.6 阅读建议
- 9 假设检验
- 9.1 无效假设统计检验(NHST)
- 9.2 无效假设统计检验:一个例子
- 9.3 无效假设检验过程
- 9.4 现代环境下的 NHST:多重测试
- 9.5 阅读建议
- 10 置信区间、效应大小和统计功率
- 10.1 置信区间
- 10.2 效果大小
- 10.3 统计能力
- 10.4 阅读建议
- 11 贝叶斯统计
- 11.1 生成模型
- 11.2 贝叶斯定理与逆推理
- 11.3 进行贝叶斯估计
- 11.4 估计后验分布
- 11.5 选择优先权
- 11.6 贝叶斯假设检验
- 11.7 阅读建议
- 12 分类关系建模
- 12.1 示例:糖果颜色
- 12.2 皮尔逊卡方检验
- 12.3 应急表及双向试验
- 12.4 标准化残差
- 12.5 优势比
- 12.6 贝叶斯系数
- 12.7 超出 2 x 2 表的分类分析
- 12.8 注意辛普森悖论
- 13 建模持续关系
- 13.1 一个例子:仇恨犯罪和收入不平等
- 13.2 收入不平等是否与仇恨犯罪有关?
- 13.3 协方差和相关性
- 13.4 相关性和因果关系
- 13.5 阅读建议
- 14 一般线性模型
- 14.1 线性回归
- 14.2 安装更复杂的模型
- 14.3 变量之间的相互作用
- 14.4“预测”的真正含义是什么?
- 14.5 阅读建议
- 15 比较方法
- 15.1 学生 T 考试
- 15.2 t 检验作为线性模型
- 15.3 平均差的贝叶斯因子
- 15.4 配对 t 检验
- 15.5 比较两种以上的方法
- 16 统计建模过程:一个实例
- 16.1 统计建模过程
- 17 做重复性研究
- 17.1 我们认为科学应该如何运作
- 17.2 科学(有时)是如何工作的
- 17.3 科学中的再现性危机
- 17.4 有问题的研究实践
- 17.5 进行重复性研究
- 17.6 进行重复性数据分析
- 17.7 结论:提高科学水平
- 17.8 阅读建议
- References
