
# 使用 t-SNE 可视化单词嵌入
让我们可视化我们在上一节中生成的单词嵌入。 t-SNE 是在二维空间中显示高维数据的最流行的方法。我们将使用 scikit-learn 库中的方法并重用 TensorFlow 文档中给出的代码来绘制我们刚学过的嵌入词的图形。
TensorFlow 文档中的原始代码可从以下链接获得:[https://github.com/tensorflow/tensorflow/blob/r1.3/tensorflow/examples/tutorials/word2vec/word2vec_basic.py.](https://github.com/tensorflow/tensorflow/blob/r1.3/tensorflow/examples/tutorials/word2vec/word2vec_basic.py)
以下是我们如何实现该程序:
1. 创建`tsne`模型:
```py
tsne = TSNE(perplexity=30, n_components=2,
init='pca', n_iter=5000, method='exact')
```
1. 将要显示的嵌入数限制为 500,否则,图形变得非常难以理解:
```py
n_embeddings = 500
```
1. 通过调用`tsne`模型上的`fit_transform()`方法并将`final_embeddings`的第一个`n_embeddings`作为输入来创建低维表示。
```py
low_dim_embeddings = tsne.fit_transform(
final_embeddings[:n_embeddings, :])
```
1. 找到我们为图表选择的单词向量的文本表示:
```py
labels = [ptb.id2word[i] for i in range(n_embeddings)]
```
1. 最后,绘制嵌入图:
```py
plot_with_labels(low_dim_embeddings, labels)
```
我们得到以下绘图:
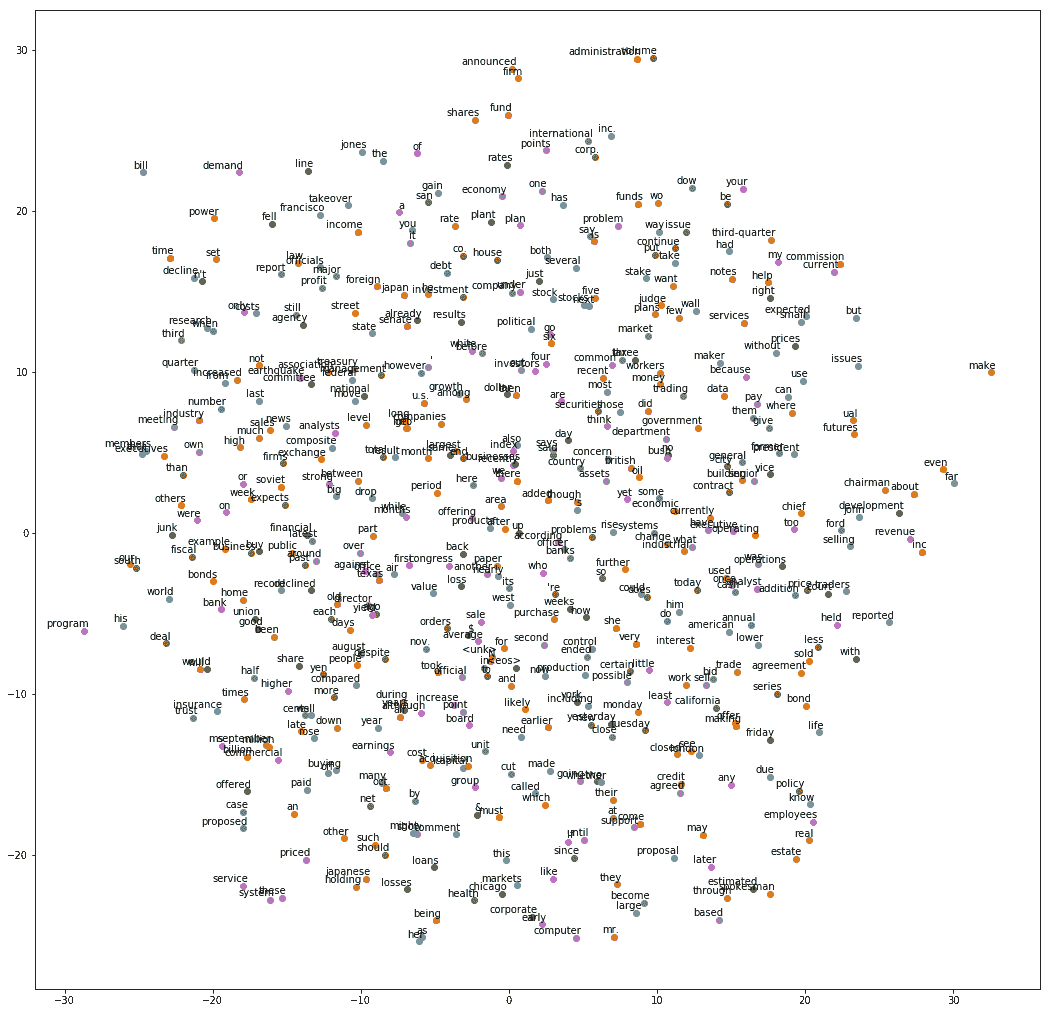t-SNE visualization of embeddings for PTB data set
同样,从 text8 模型中,我们得到以下图:
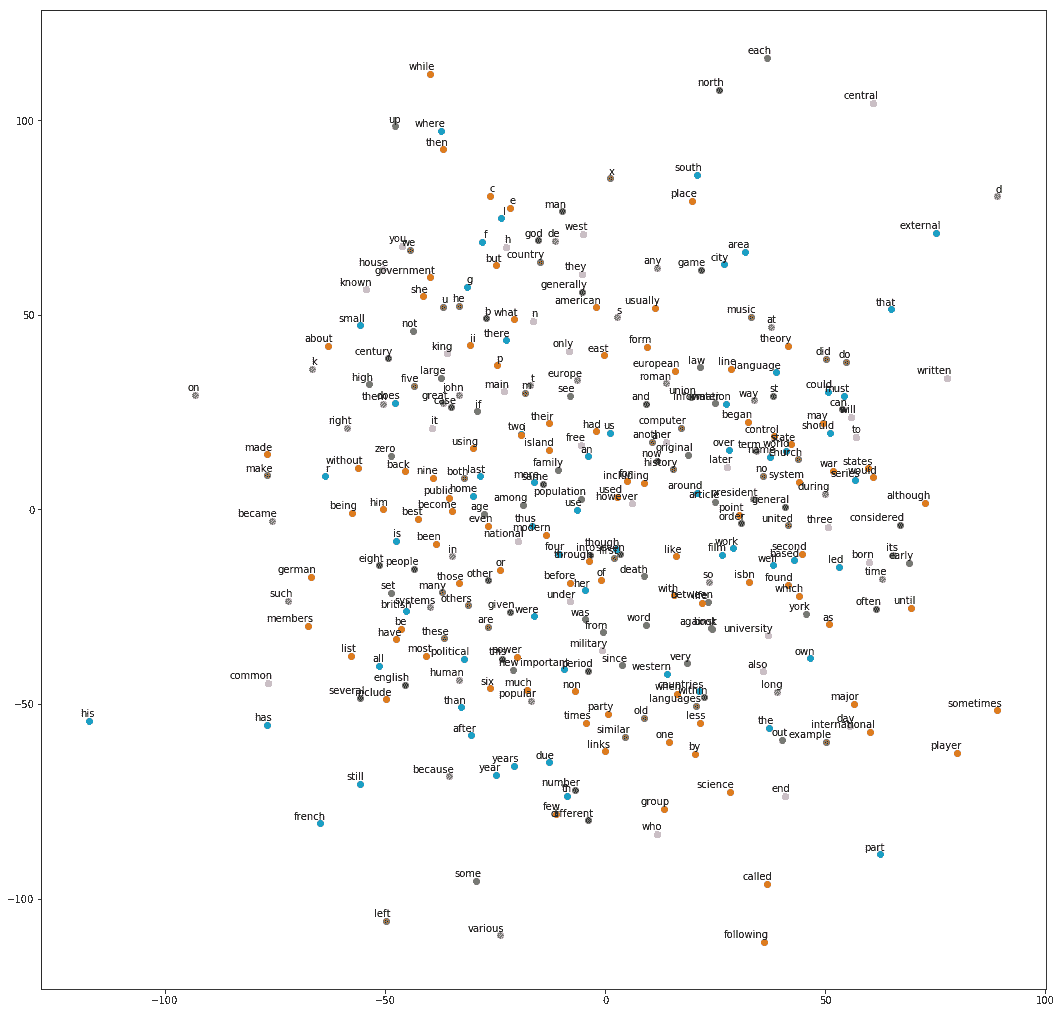t-SNE visualization of embeddings for text8 data set
- TensorFlow 101
- 什么是 TensorFlow?
- TensorFlow 核心
- 代码预热 - Hello TensorFlow
- 张量
- 常量
- 操作
- 占位符
- 从 Python 对象创建张量
- 变量
- 从库函数生成的张量
- 使用相同的值填充张量元素
- 用序列填充张量元素
- 使用随机分布填充张量元素
- 使用tf.get_variable()获取变量
- 数据流图或计算图
- 执行顺序和延迟加载
- 跨计算设备执行图 - CPU 和 GPU
- 将图节点放置在特定的计算设备上
- 简单放置
- 动态展示位置
- 软放置
- GPU 内存处理
- 多个图
- TensorBoard
- TensorBoard 最小的例子
- TensorBoard 详情
- 总结
- TensorFlow 的高级库
- TF Estimator - 以前的 TF 学习
- TF Slim
- TFLearn
- 创建 TFLearn 层
- TFLearn 核心层
- TFLearn 卷积层
- TFLearn 循环层
- TFLearn 正则化层
- TFLearn 嵌入层
- TFLearn 合并层
- TFLearn 估计层
- 创建 TFLearn 模型
- TFLearn 模型的类型
- 训练 TFLearn 模型
- 使用 TFLearn 模型
- PrettyTensor
- Sonnet
- 总结
- Keras 101
- 安装 Keras
- Keras 中的神经网络模型
- 在 Keras 建立模型的工作流程
- 创建 Keras 模型
- 用于创建 Keras 模型的顺序 API
- 用于创建 Keras 模型的函数式 API
- Keras 层
- Keras 核心层
- Keras 卷积层
- Keras 池化层
- Keras 本地连接层
- Keras 循环层
- Keras 嵌入层
- Keras 合并层
- Keras 高级激活层
- Keras 正则化层
- Keras 噪音层
- 将层添加到 Keras 模型
- 用于将层添加到 Keras 模型的顺序 API
- 用于向 Keras 模型添加层的函数式 API
- 编译 Keras 模型
- 训练 Keras 模型
- 使用 Keras 模型进行预测
- Keras 的附加模块
- MNIST 数据集的 Keras 序列模型示例
- 总结
- 使用 TensorFlow 进行经典机器学习
- 简单的线性回归
- 数据准备
- 构建一个简单的回归模型
- 定义输入,参数和其他变量
- 定义模型
- 定义损失函数
- 定义优化器函数
- 训练模型
- 使用训练的模型进行预测
- 多元回归
- 正则化回归
- 套索正则化
- 岭正则化
- ElasticNet 正则化
- 使用逻辑回归进行分类
- 二分类的逻辑回归
- 多类分类的逻辑回归
- 二分类
- 多类分类
- 总结
- 使用 TensorFlow 和 Keras 的神经网络和 MLP
- 感知机
- 多层感知机
- 用于图像分类的 MLP
- 用于 MNIST 分类的基于 TensorFlow 的 MLP
- 用于 MNIST 分类的基于 Keras 的 MLP
- 用于 MNIST 分类的基于 TFLearn 的 MLP
- 使用 TensorFlow,Keras 和 TFLearn 的 MLP 总结
- 用于时间序列回归的 MLP
- 总结
- 使用 TensorFlow 和 Keras 的 RNN
- 简单循环神经网络
- RNN 变种
- LSTM 网络
- GRU 网络
- TensorFlow RNN
- TensorFlow RNN 单元类
- TensorFlow RNN 模型构建类
- TensorFlow RNN 单元包装器类
- 适用于 RNN 的 Keras
- RNN 的应用领域
- 用于 MNIST 数据的 Keras 中的 RNN
- 总结
- 使用 TensorFlow 和 Keras 的时间序列数据的 RNN
- 航空公司乘客数据集
- 加载 airpass 数据集
- 可视化 airpass 数据集
- 使用 TensorFlow RNN 模型预处理数据集
- TensorFlow 中的简单 RNN
- TensorFlow 中的 LSTM
- TensorFlow 中的 GRU
- 使用 Keras RNN 模型预处理数据集
- 使用 Keras 的简单 RNN
- 使用 Keras 的 LSTM
- 使用 Keras 的 GRU
- 总结
- 使用 TensorFlow 和 Keras 的文本数据的 RNN
- 词向量表示
- 为 word2vec 模型准备数据
- 加载和准备 PTB 数据集
- 加载和准备 text8 数据集
- 准备小验证集
- 使用 TensorFlow 的 skip-gram 模型
- 使用 t-SNE 可视化单词嵌入
- keras 的 skip-gram 模型
- 使用 TensorFlow 和 Keras 中的 RNN 模型生成文本
- TensorFlow 中的 LSTM 文本生成
- Keras 中的 LSTM 文本生成
- 总结
- 使用 TensorFlow 和 Keras 的 CNN
- 理解卷积
- 了解池化
- CNN 架构模式 - LeNet
- 用于 MNIST 数据的 LeNet
- 使用 TensorFlow 的用于 MNIST 的 LeNet CNN
- 使用 Keras 的用于 MNIST 的 LeNet CNN
- 用于 CIFAR10 数据的 LeNet
- 使用 TensorFlow 的用于 CIFAR10 的 ConvNets
- 使用 Keras 的用于 CIFAR10 的 ConvNets
- 总结
- 使用 TensorFlow 和 Keras 的自编码器
- 自编码器类型
- TensorFlow 中的栈式自编码器
- Keras 中的栈式自编码器
- TensorFlow 中的去噪自编码器
- Keras 中的去噪自编码器
- TensorFlow 中的变分自编码器
- Keras 中的变分自编码器
- 总结
- TF 服务:生产中的 TensorFlow 模型
- 在 TensorFlow 中保存和恢复模型
- 使用保护程序类保存和恢复所有图变量
- 使用保护程序类保存和恢复所选变量
- 保存和恢复 Keras 模型
- TensorFlow 服务
- 安装 TF 服务
- 保存 TF 服务的模型
- 提供 TF 服务模型
- 在 Docker 容器中提供 TF 服务
- 安装 Docker
- 为 TF 服务构建 Docker 镜像
- 在 Docker 容器中提供模型
- Kubernetes 中的 TensorFlow 服务
- 安装 Kubernetes
- 将 Docker 镜像上传到 dockerhub
- 在 Kubernetes 部署
- 总结
- 迁移学习和预训练模型
- ImageNet 数据集
- 再训练或微调模型
- COCO 动物数据集和预处理图像
- TensorFlow 中的 VGG16
- 使用 TensorFlow 中预训练的 VGG16 进行图像分类
- TensorFlow 中的图像预处理,用于预训练的 VGG16
- 使用 TensorFlow 中的再训练的 VGG16 进行图像分类
- Keras 的 VGG16
- 使用 Keras 中预训练的 VGG16 进行图像分类
- 使用 Keras 中再训练的 VGG16 进行图像分类
- TensorFlow 中的 Inception v3
- 使用 TensorFlow 中的 Inception v3 进行图像分类
- 使用 TensorFlow 中的再训练的 Inception v3 进行图像分类
- 总结
- 深度强化学习
- OpenAI Gym 101
- 将简单的策略应用于 cartpole 游戏
- 强化学习 101
- Q 函数(在模型不可用时学习优化)
- RL 算法的探索与开发
- V 函数(模型可用时学习优化)
- 强化学习技巧
- 强化学习的朴素神经网络策略
- 实现 Q-Learning
- Q-Learning 的初始化和离散化
- 使用 Q-Table 进行 Q-Learning
- Q-Network 或深 Q 网络(DQN)的 Q-Learning
- 总结
- 生成性对抗网络
- 生成性对抗网络 101
- 建立和训练 GAN 的最佳实践
- 使用 TensorFlow 的简单的 GAN
- 使用 Keras 的简单的 GAN
- 使用 TensorFlow 和 Keras 的深度卷积 GAN
- 总结
- 使用 TensorFlow 集群的分布式模型
- 分布式执行策略
- TensorFlow 集群
- 定义集群规范
- 创建服务器实例
- 定义服务器和设备之间的参数和操作
- 定义并训练图以进行异步更新
- 定义并训练图以进行同步更新
- 总结
- 移动和嵌入式平台上的 TensorFlow 模型
- 移动平台上的 TensorFlow
- Android 应用中的 TF Mobile
- Android 上的 TF Mobile 演示
- iOS 应用中的 TF Mobile
- iOS 上的 TF Mobile 演示
- TensorFlow Lite
- Android 上的 TF Lite 演示
- iOS 上的 TF Lite 演示
- 总结
- R 中的 TensorFlow 和 Keras
- 在 R 中安装 TensorFlow 和 Keras 软件包
- R 中的 TF 核心 API
- R 中的 TF 估计器 API
- R 中的 Keras API
- R 中的 TensorBoard
- R 中的 tfruns 包
- 总结
- 调试 TensorFlow 模型
- 使用tf.Session.run()获取张量值
- 使用tf.Print()打印张量值
- 用tf.Assert()断言条件
- 使用 TensorFlow 调试器(tfdbg)进行调试
- 总结
- 张量处理单元